Learning Analytics Dashboard
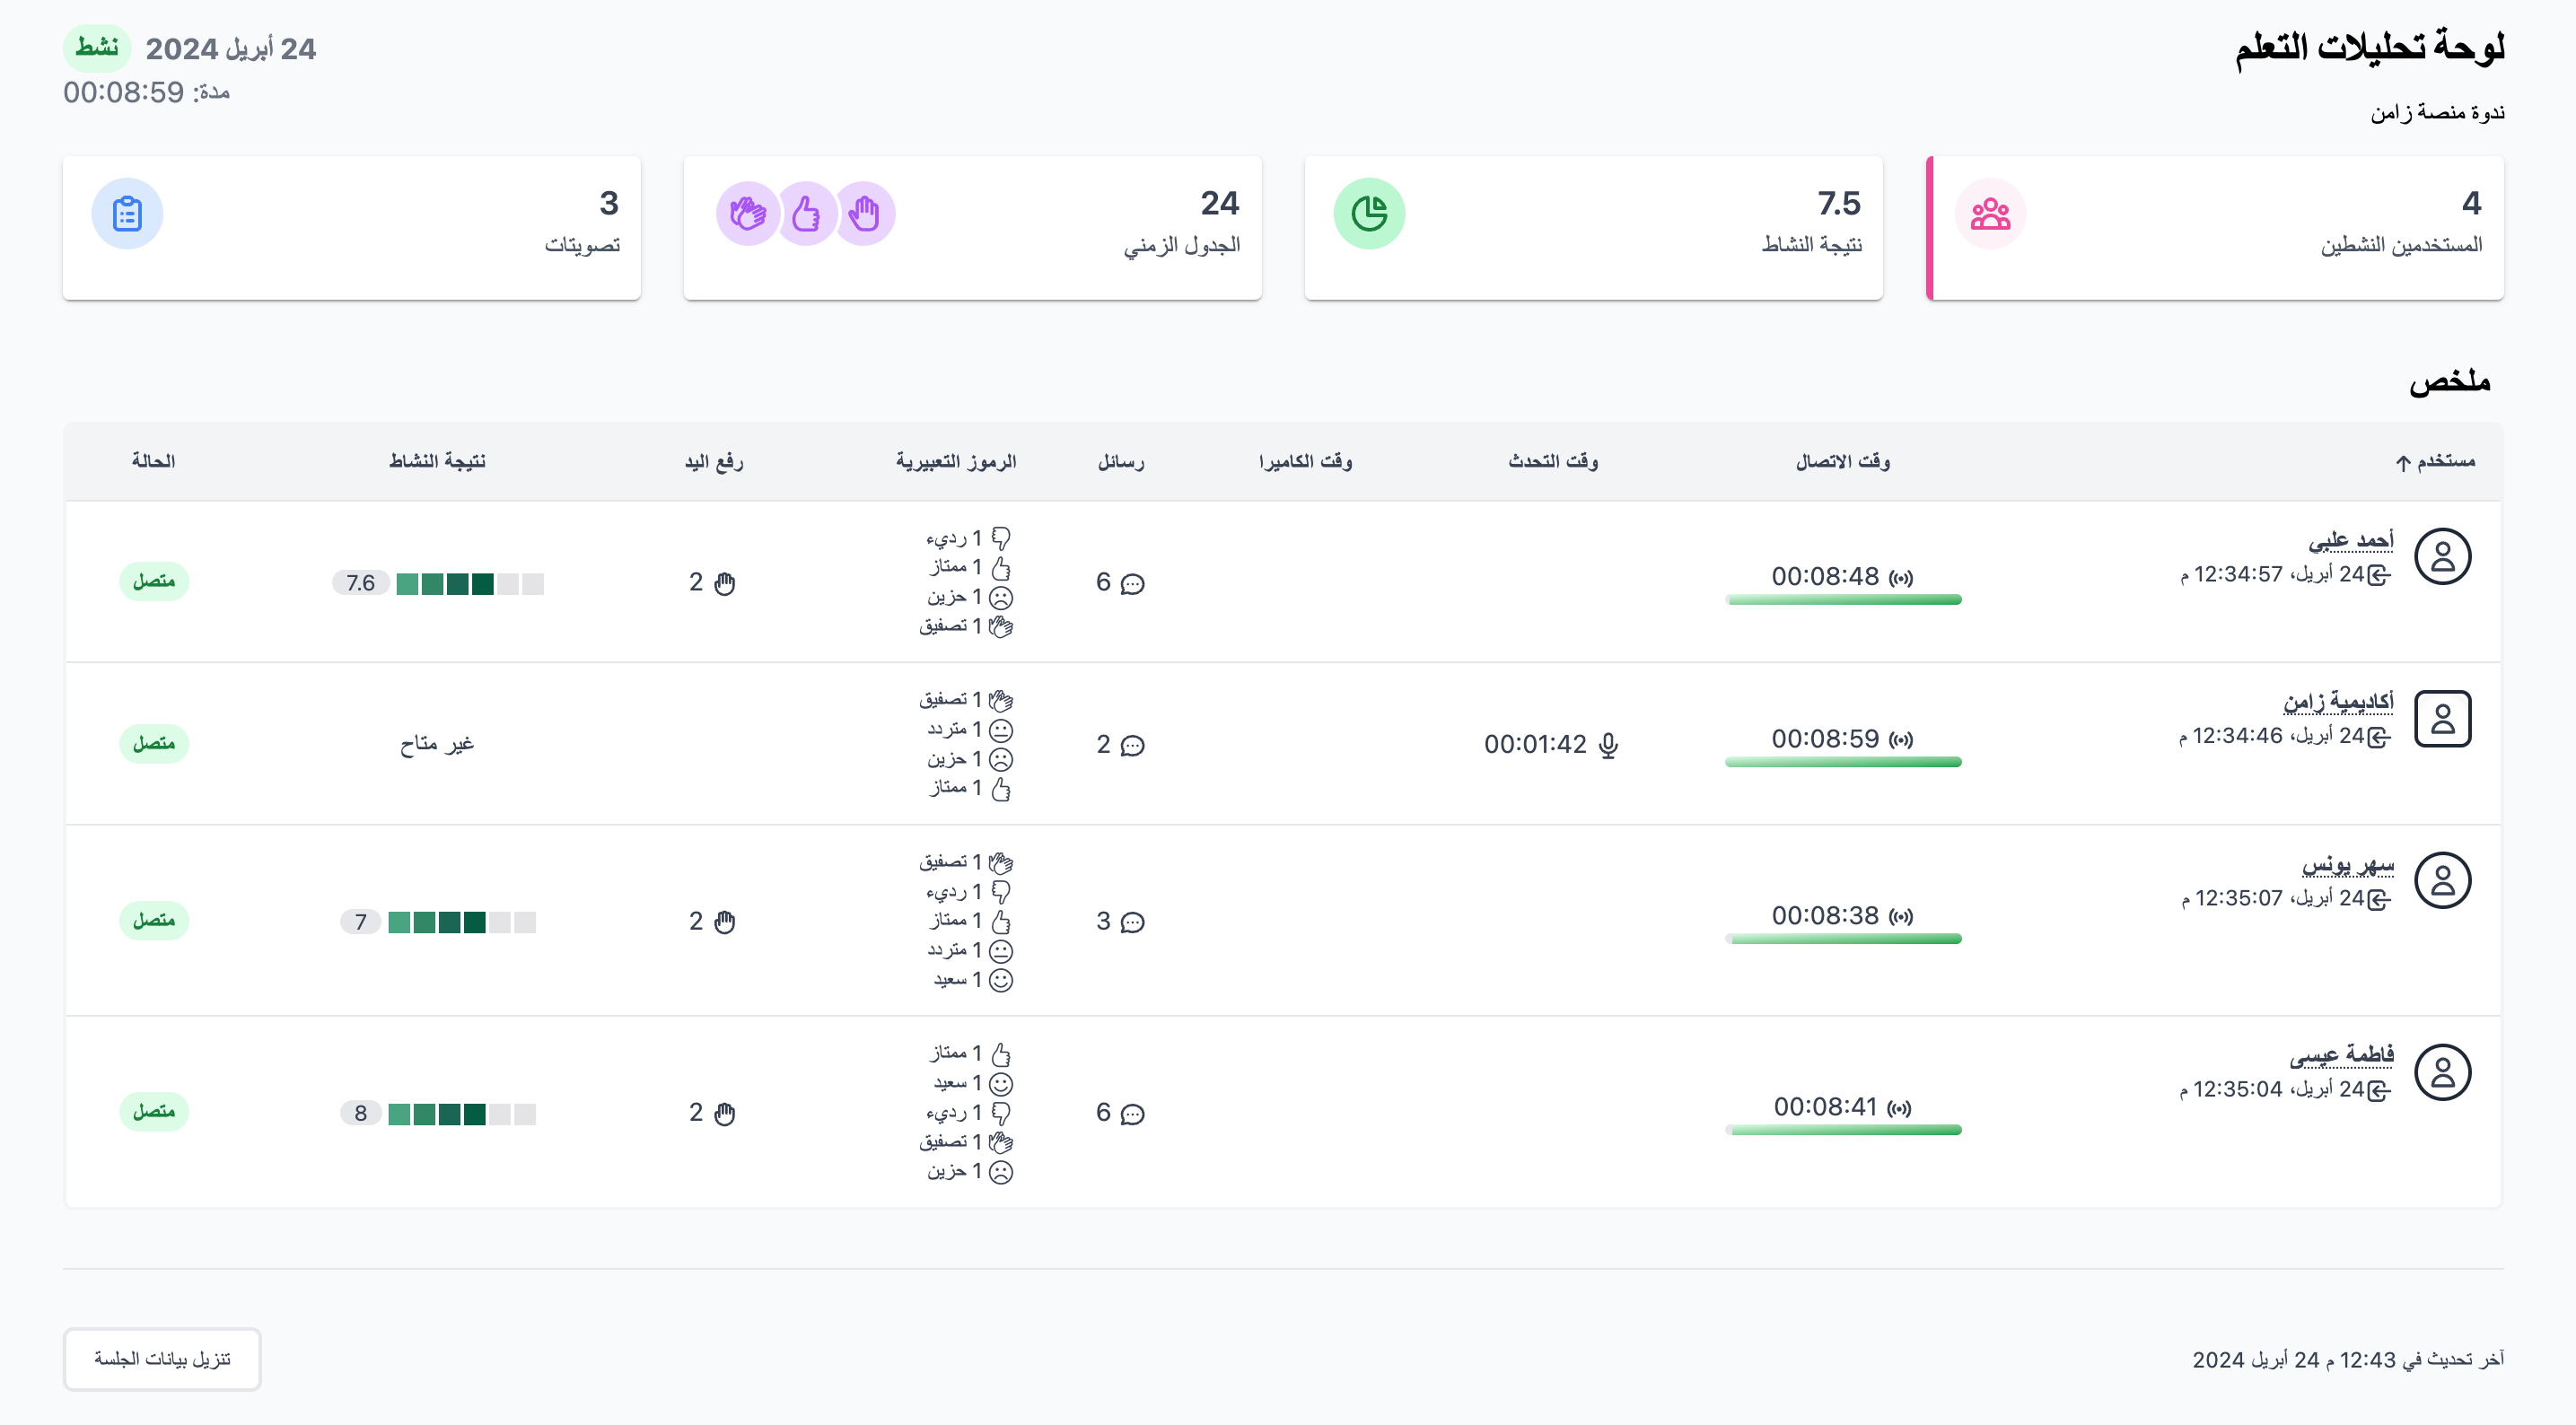
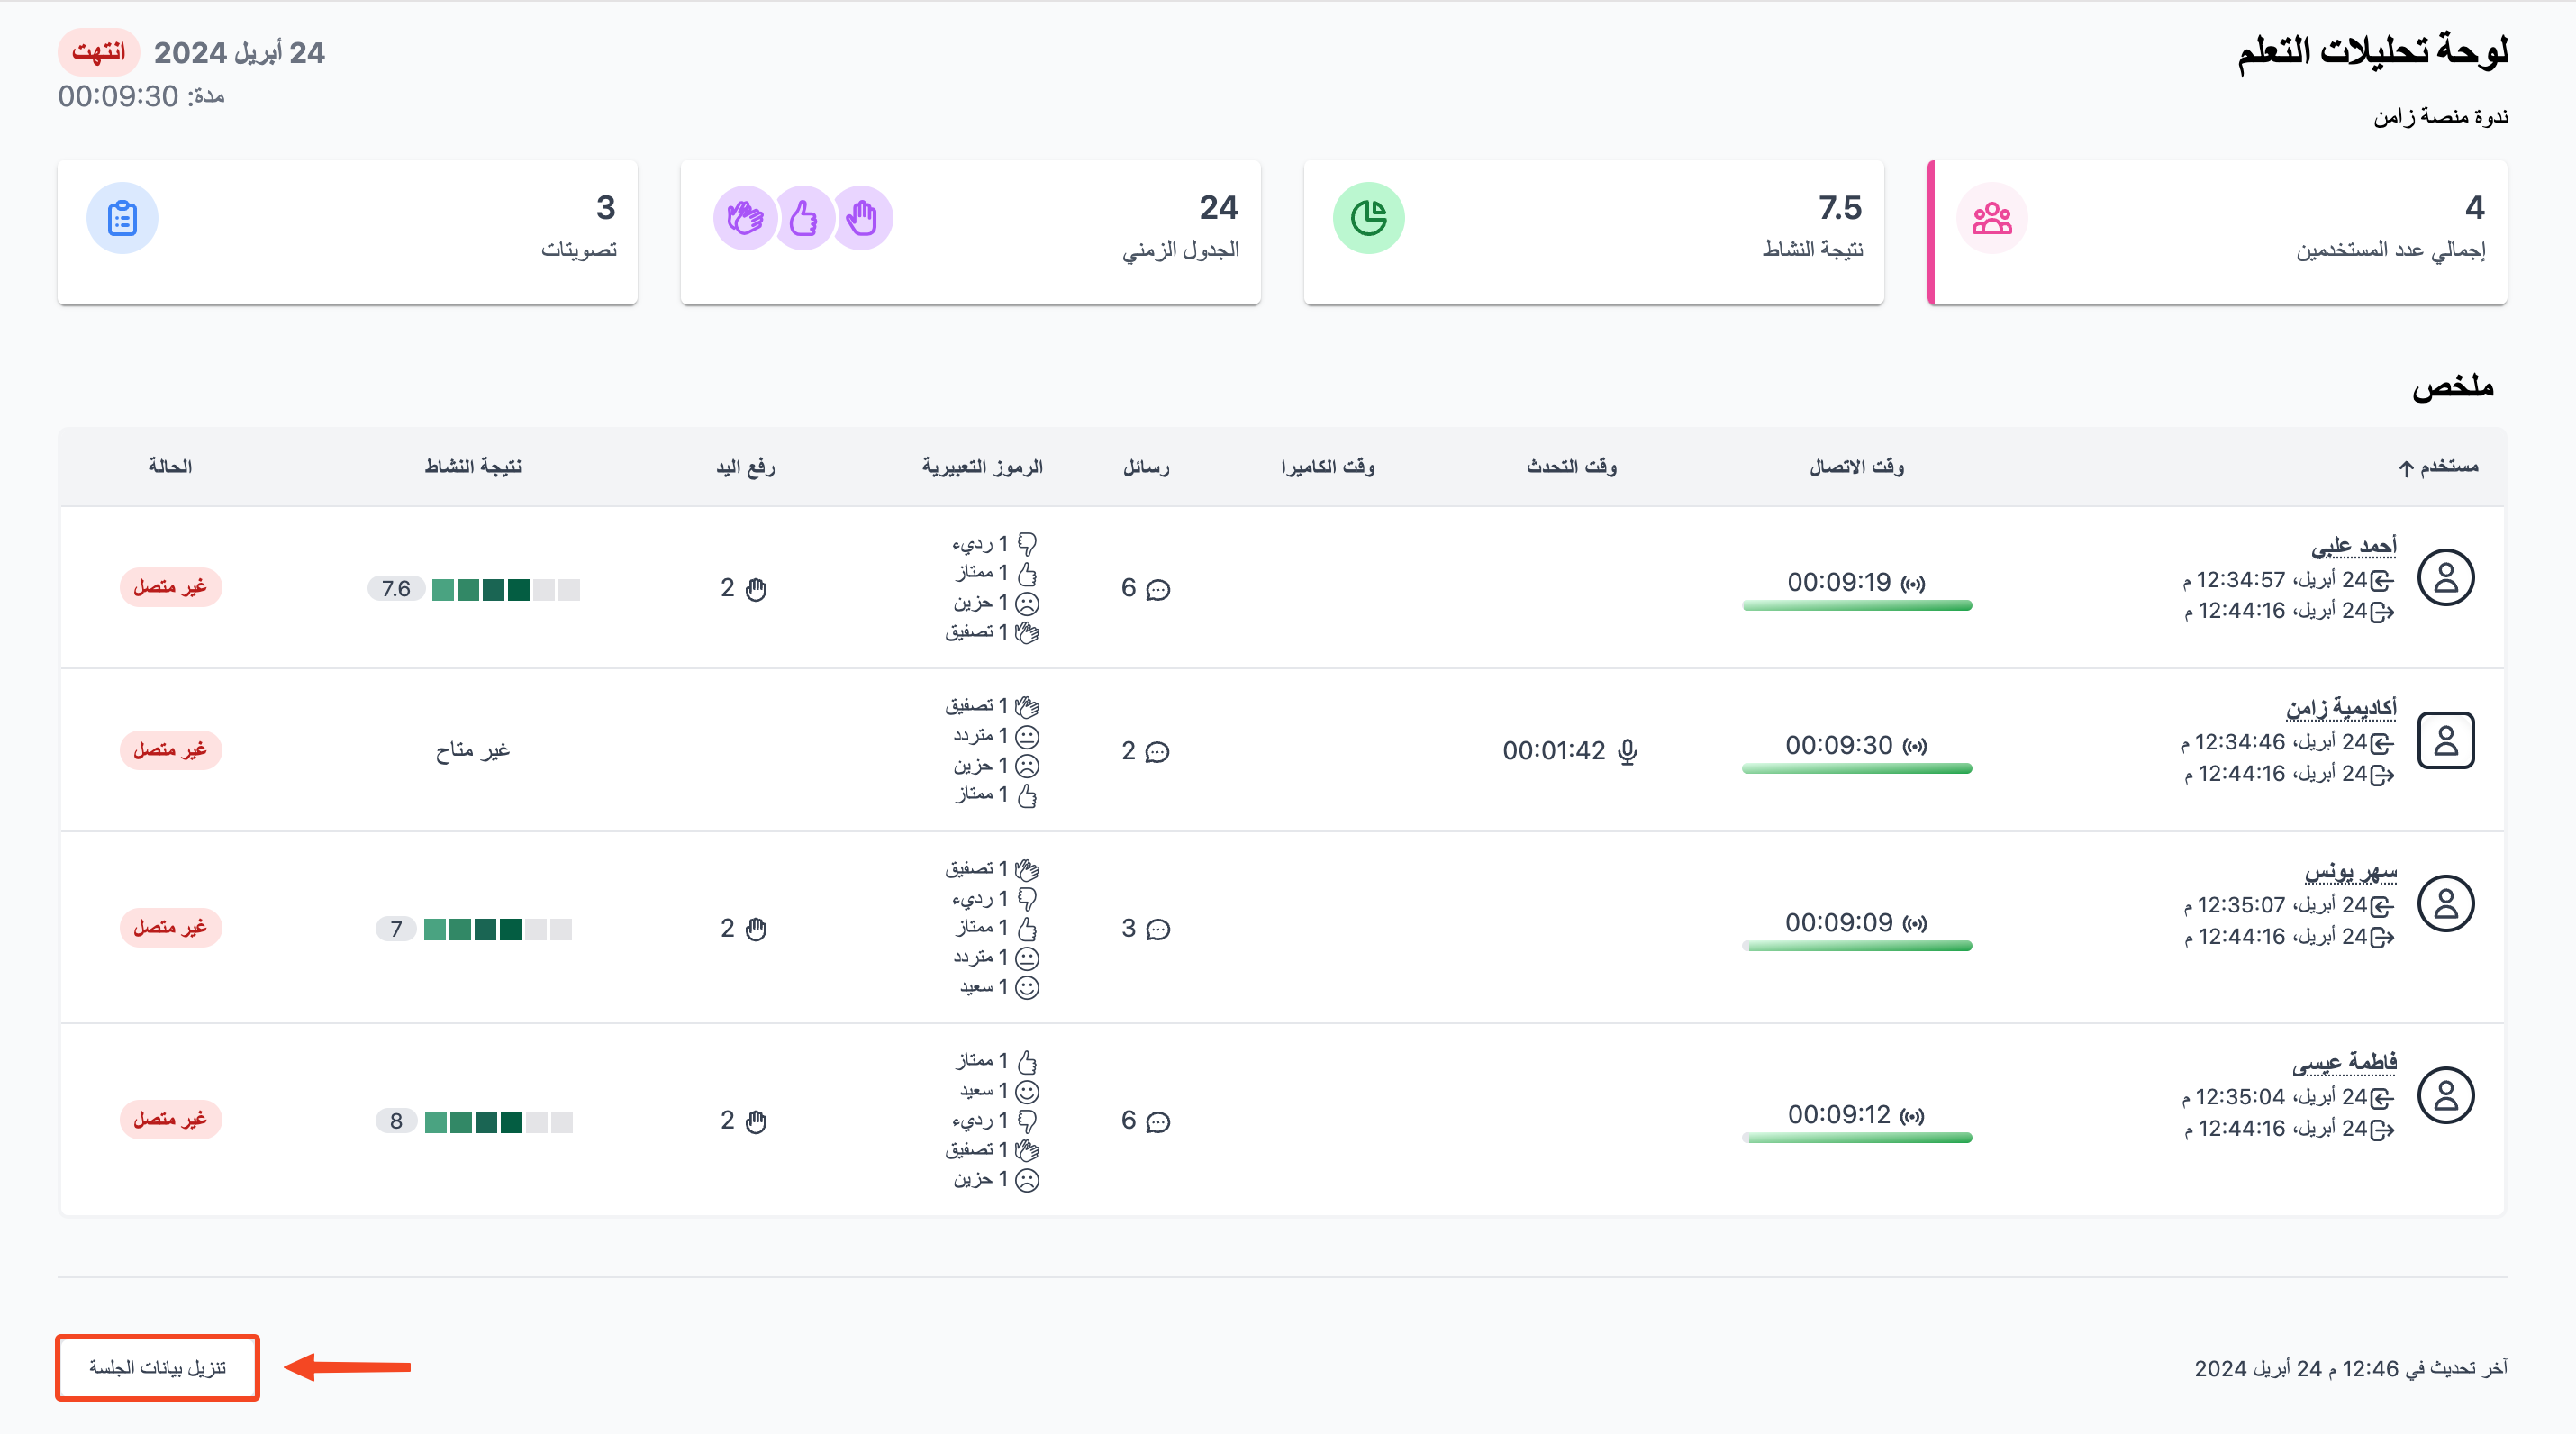
The Learning Analytics Dashboard gives room moderators a summary of how attendees took part in the session: the number of users, the activity score, the interactions and the poll results.
You can open the Learning Analytics Dashboard in two ways:
- From inside the room during the session (the dashboard shows as Active).
- When you close the room.
Steps to open the dashboard from inside the room
-
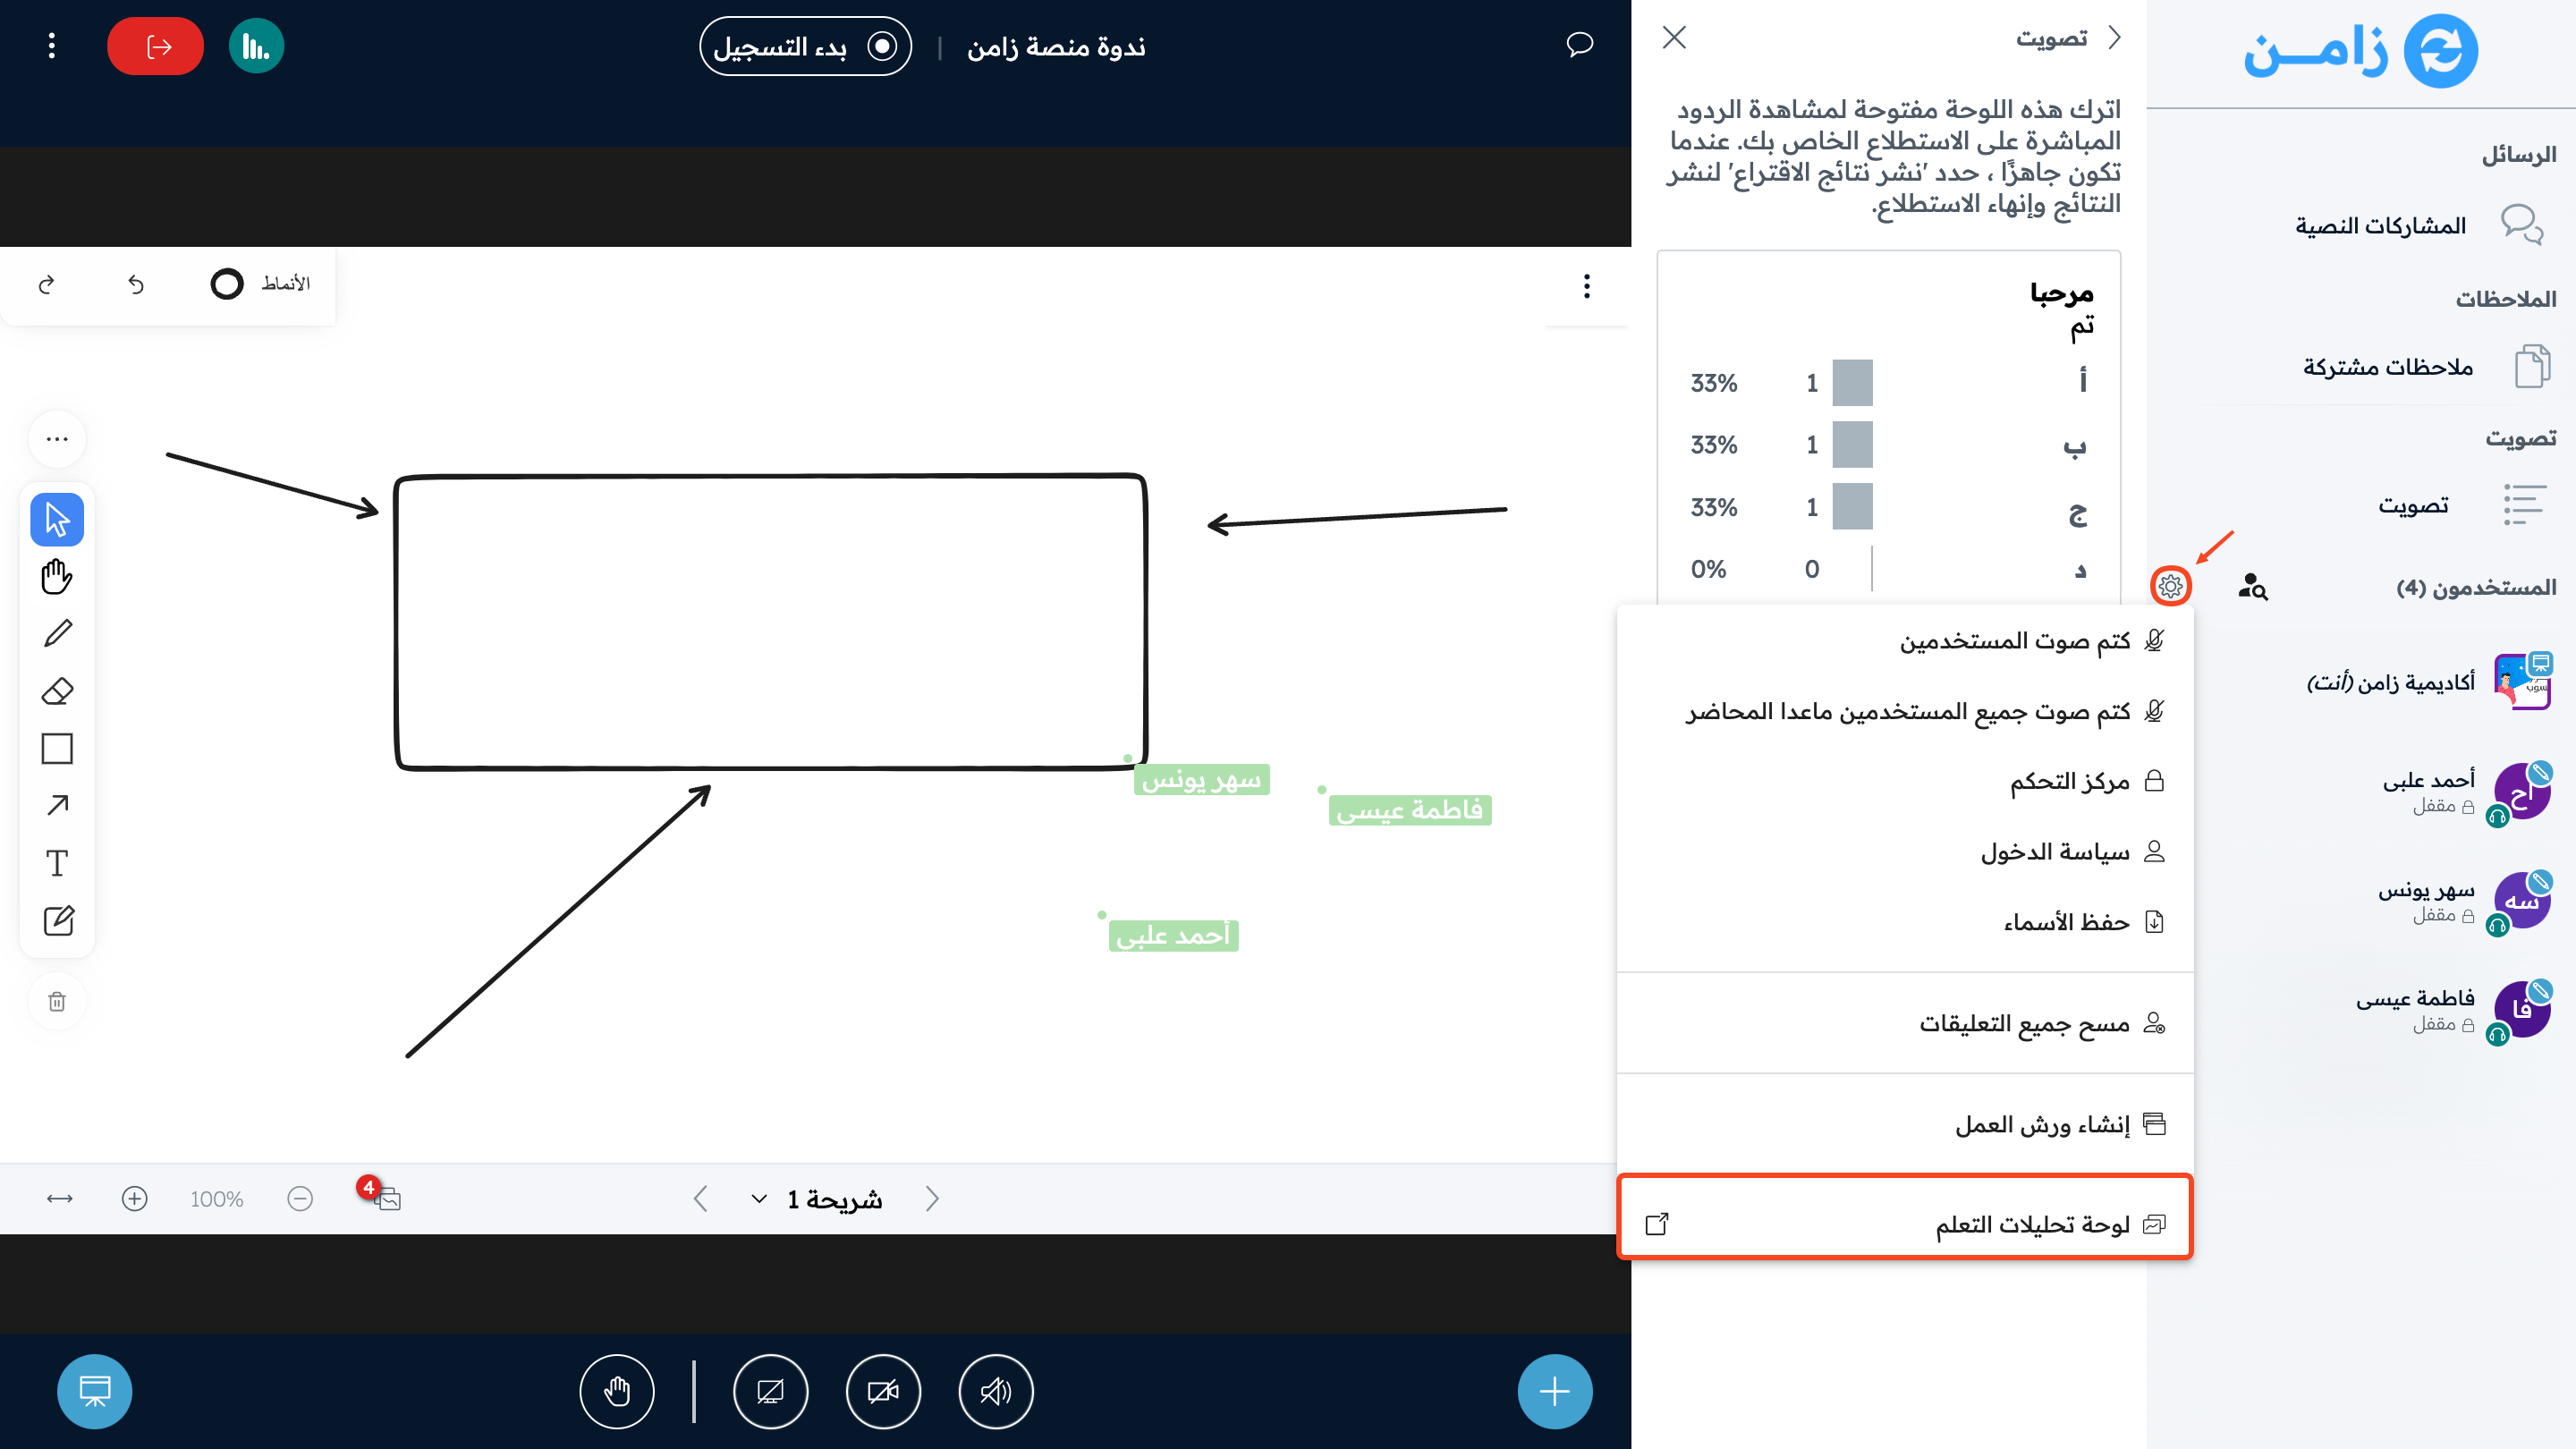
Click the settings (gear) button next to Users.
-
Click Learning Analytics Dashboard.
The dashboard opens as Active.
Steps to open the dashboard when you close the room
-
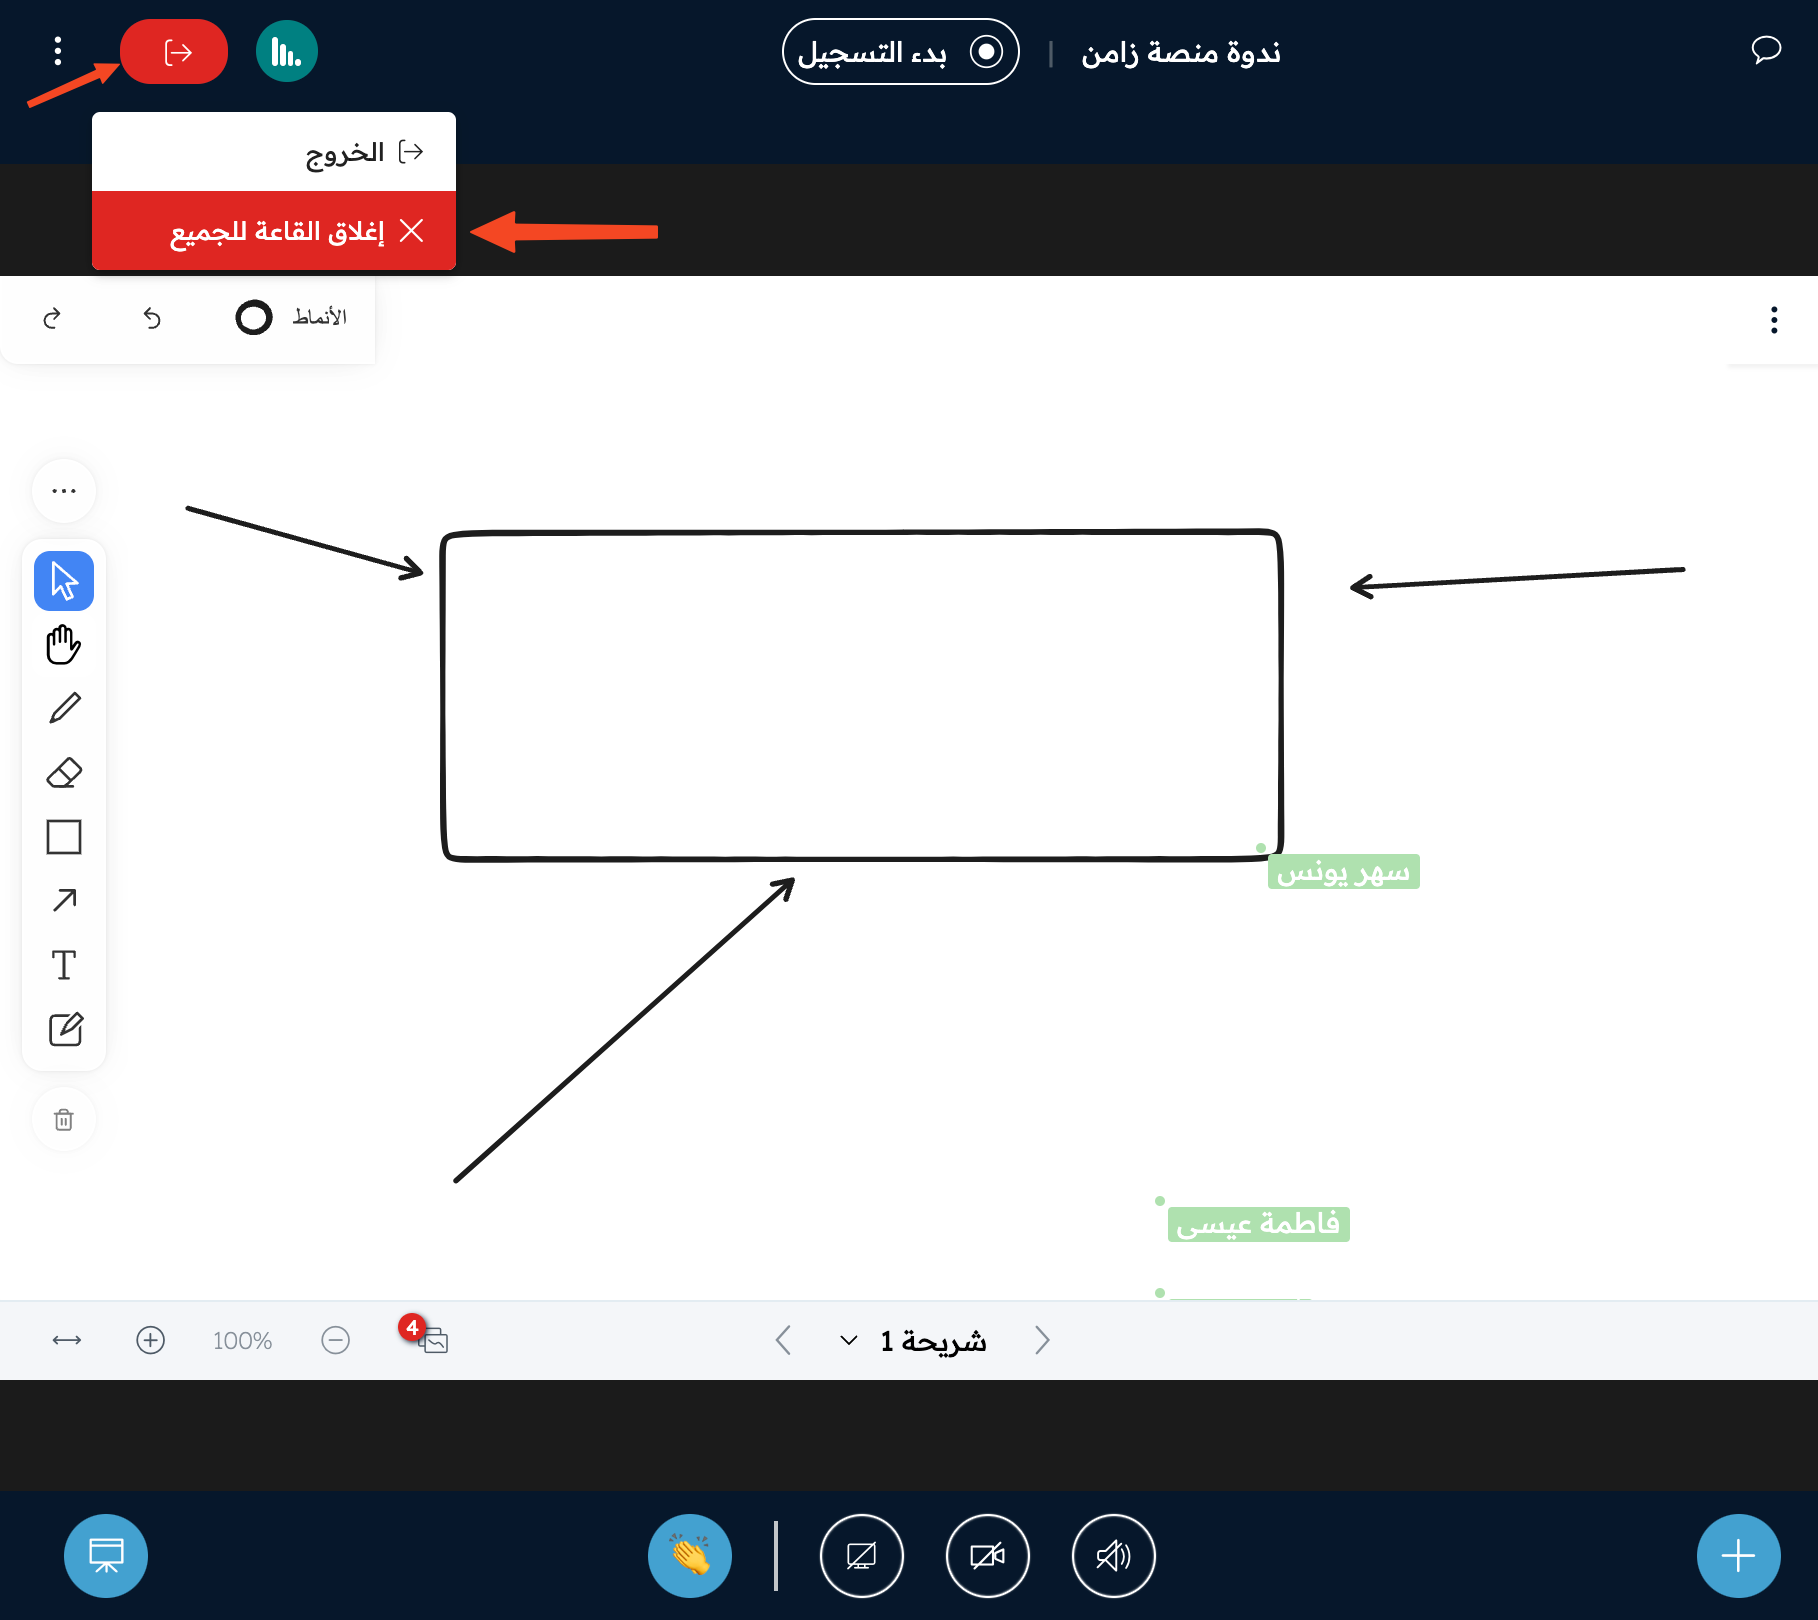
After the session ends, click the leave button.
-
Click End meeting for all.
-
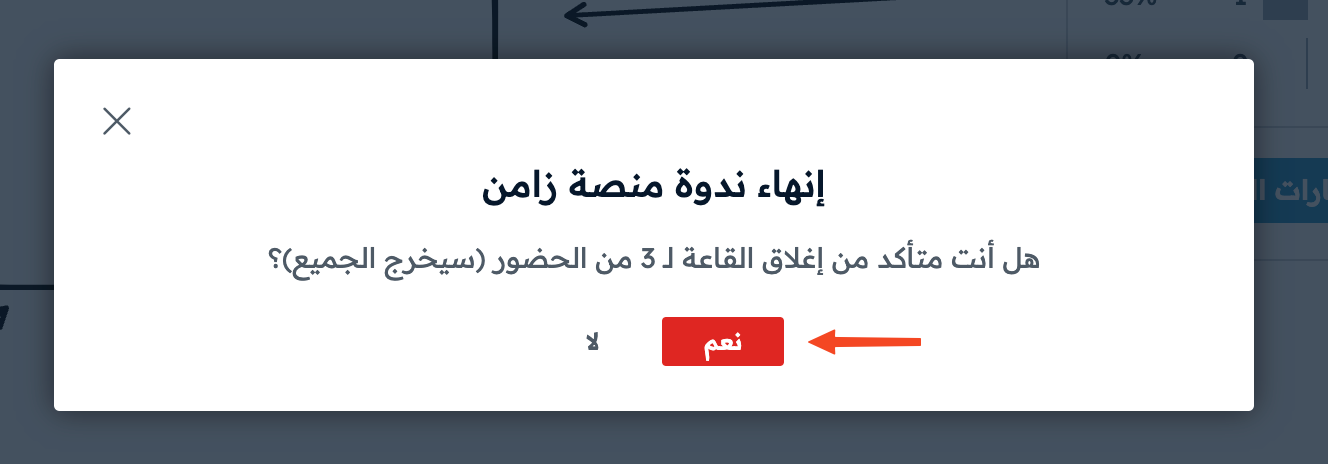
Click Yes to confirm closing the room for everyone.
-
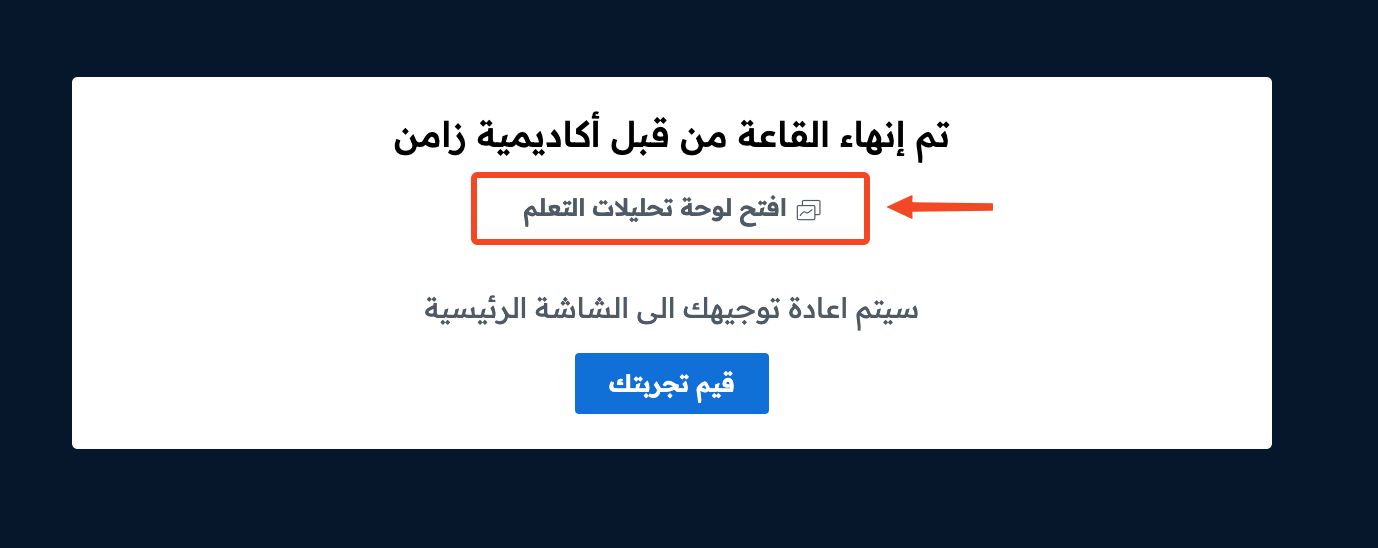
Click Open Learning Analytics Dashboard.
Session summary
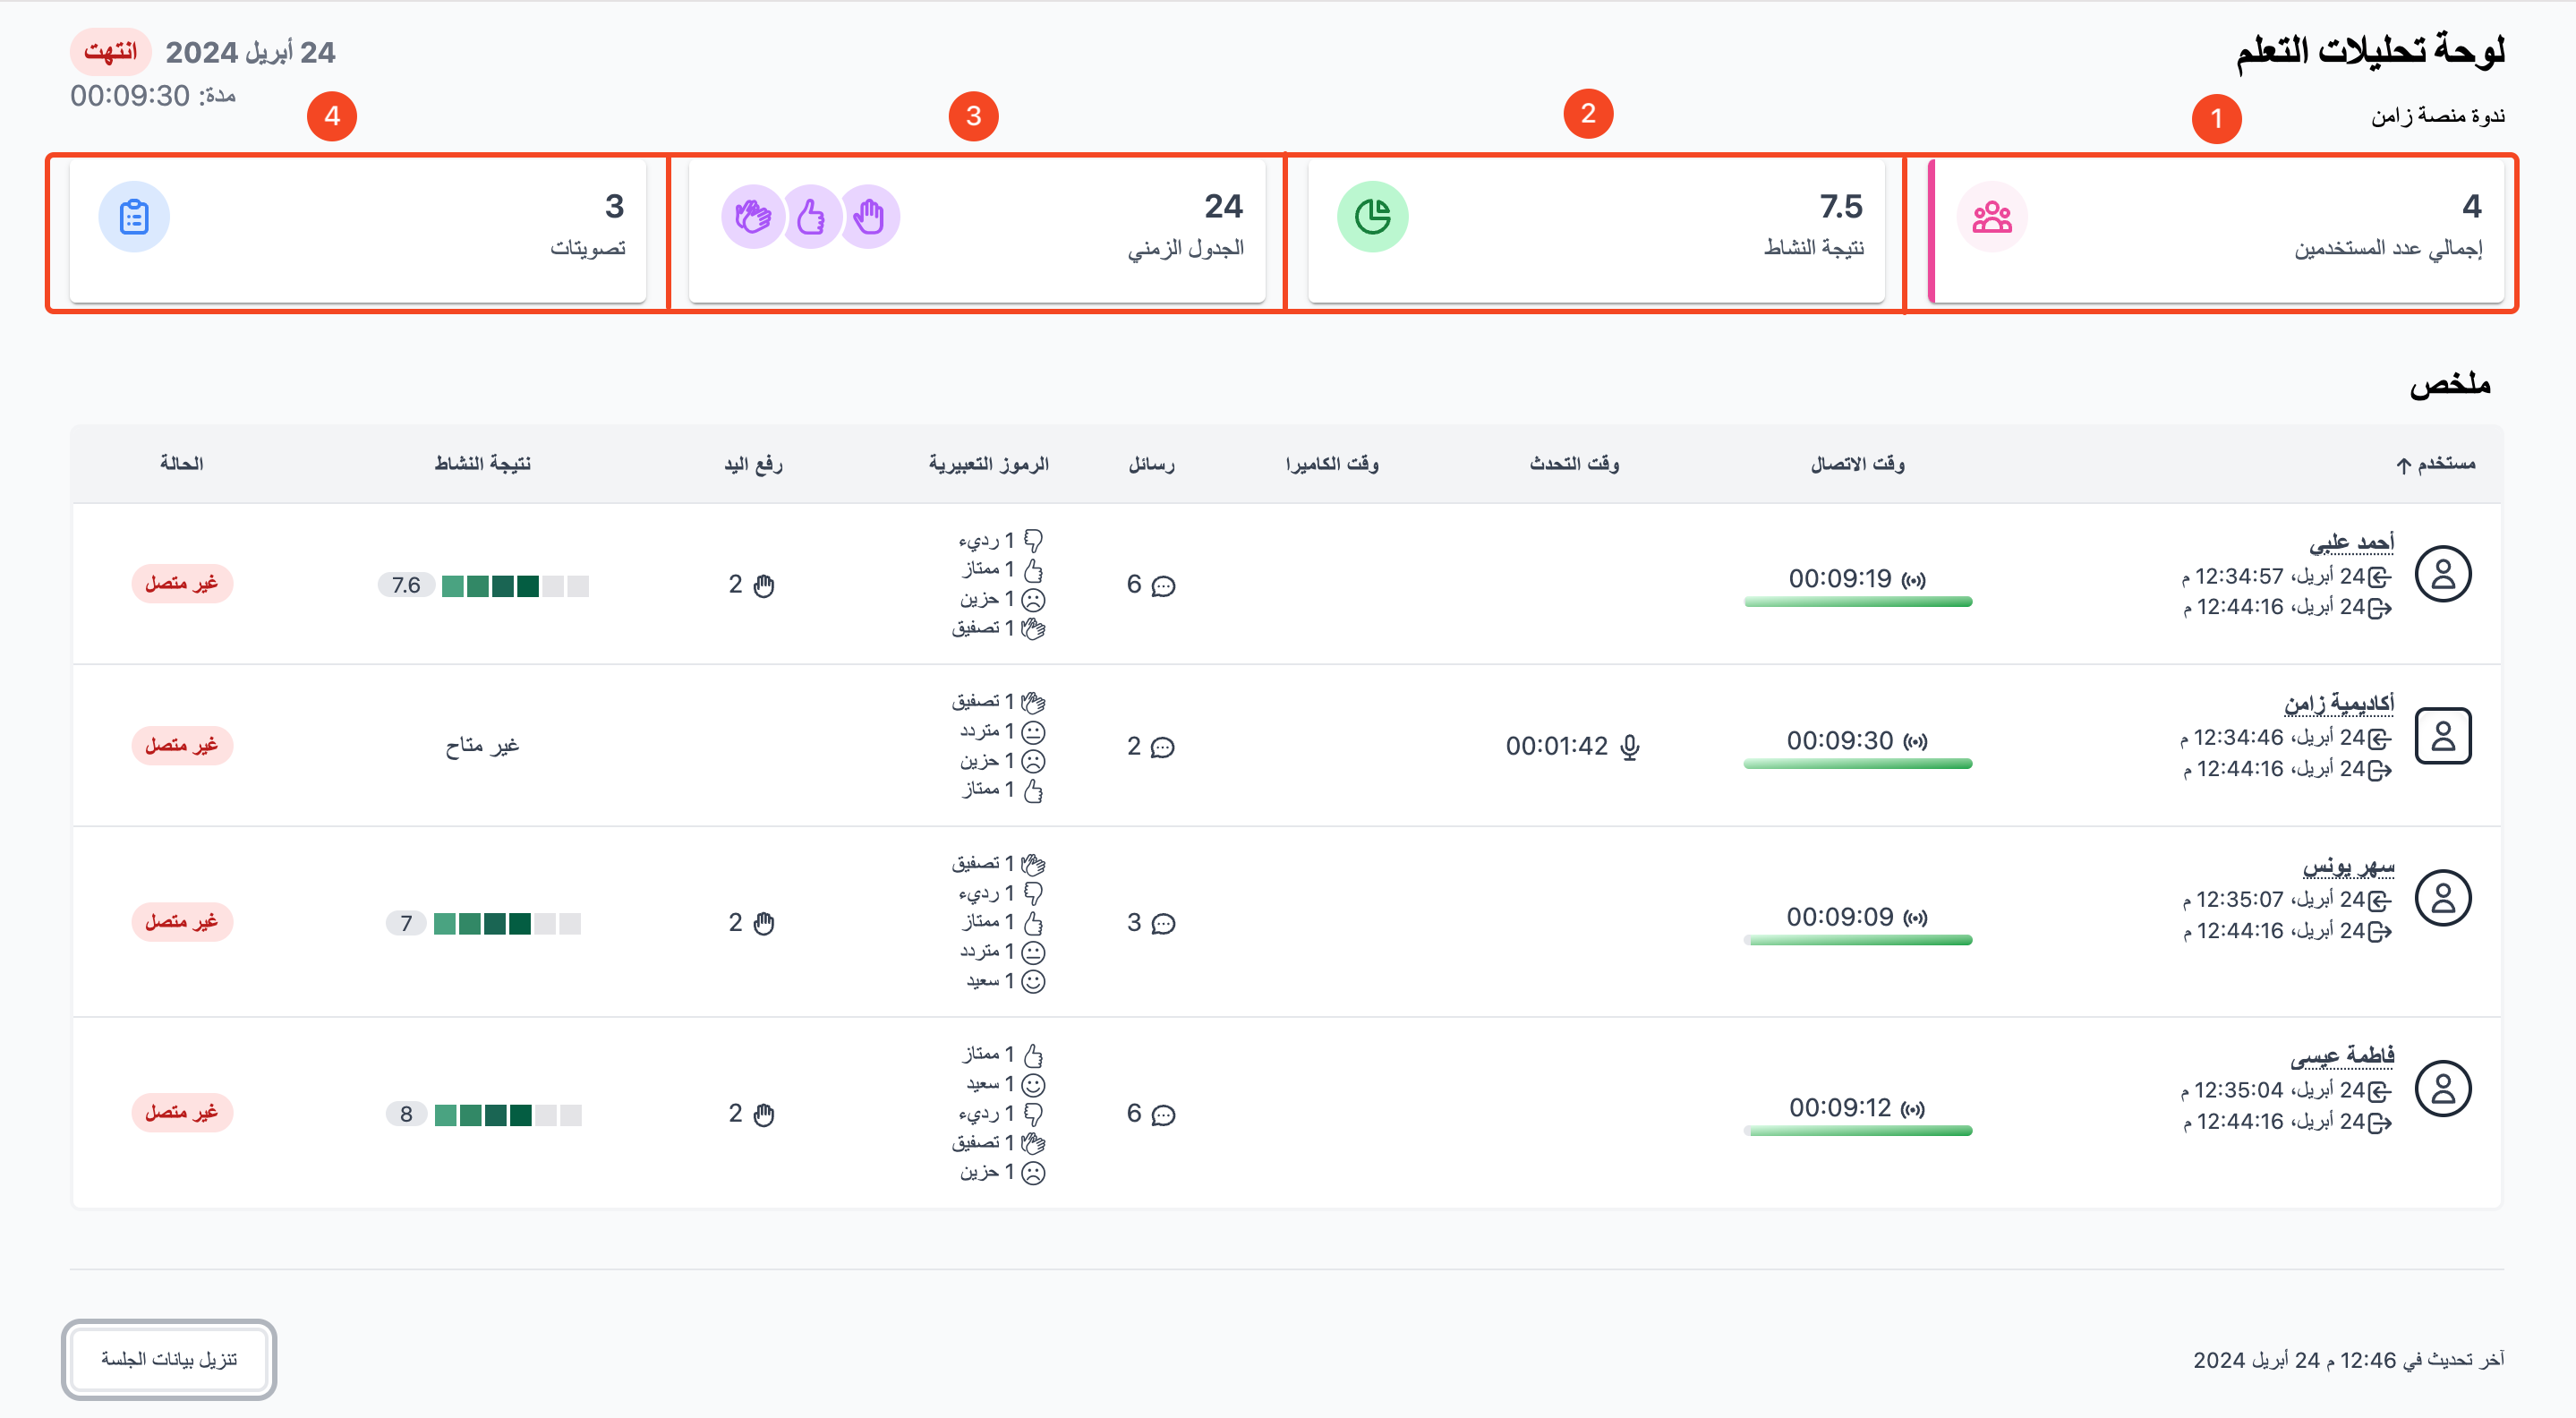
The session summary shows four main points:
- The total number of users (including moderators).
- The average activity score.
- The interactions on the session timeline.
- The poll results.
Total number of users
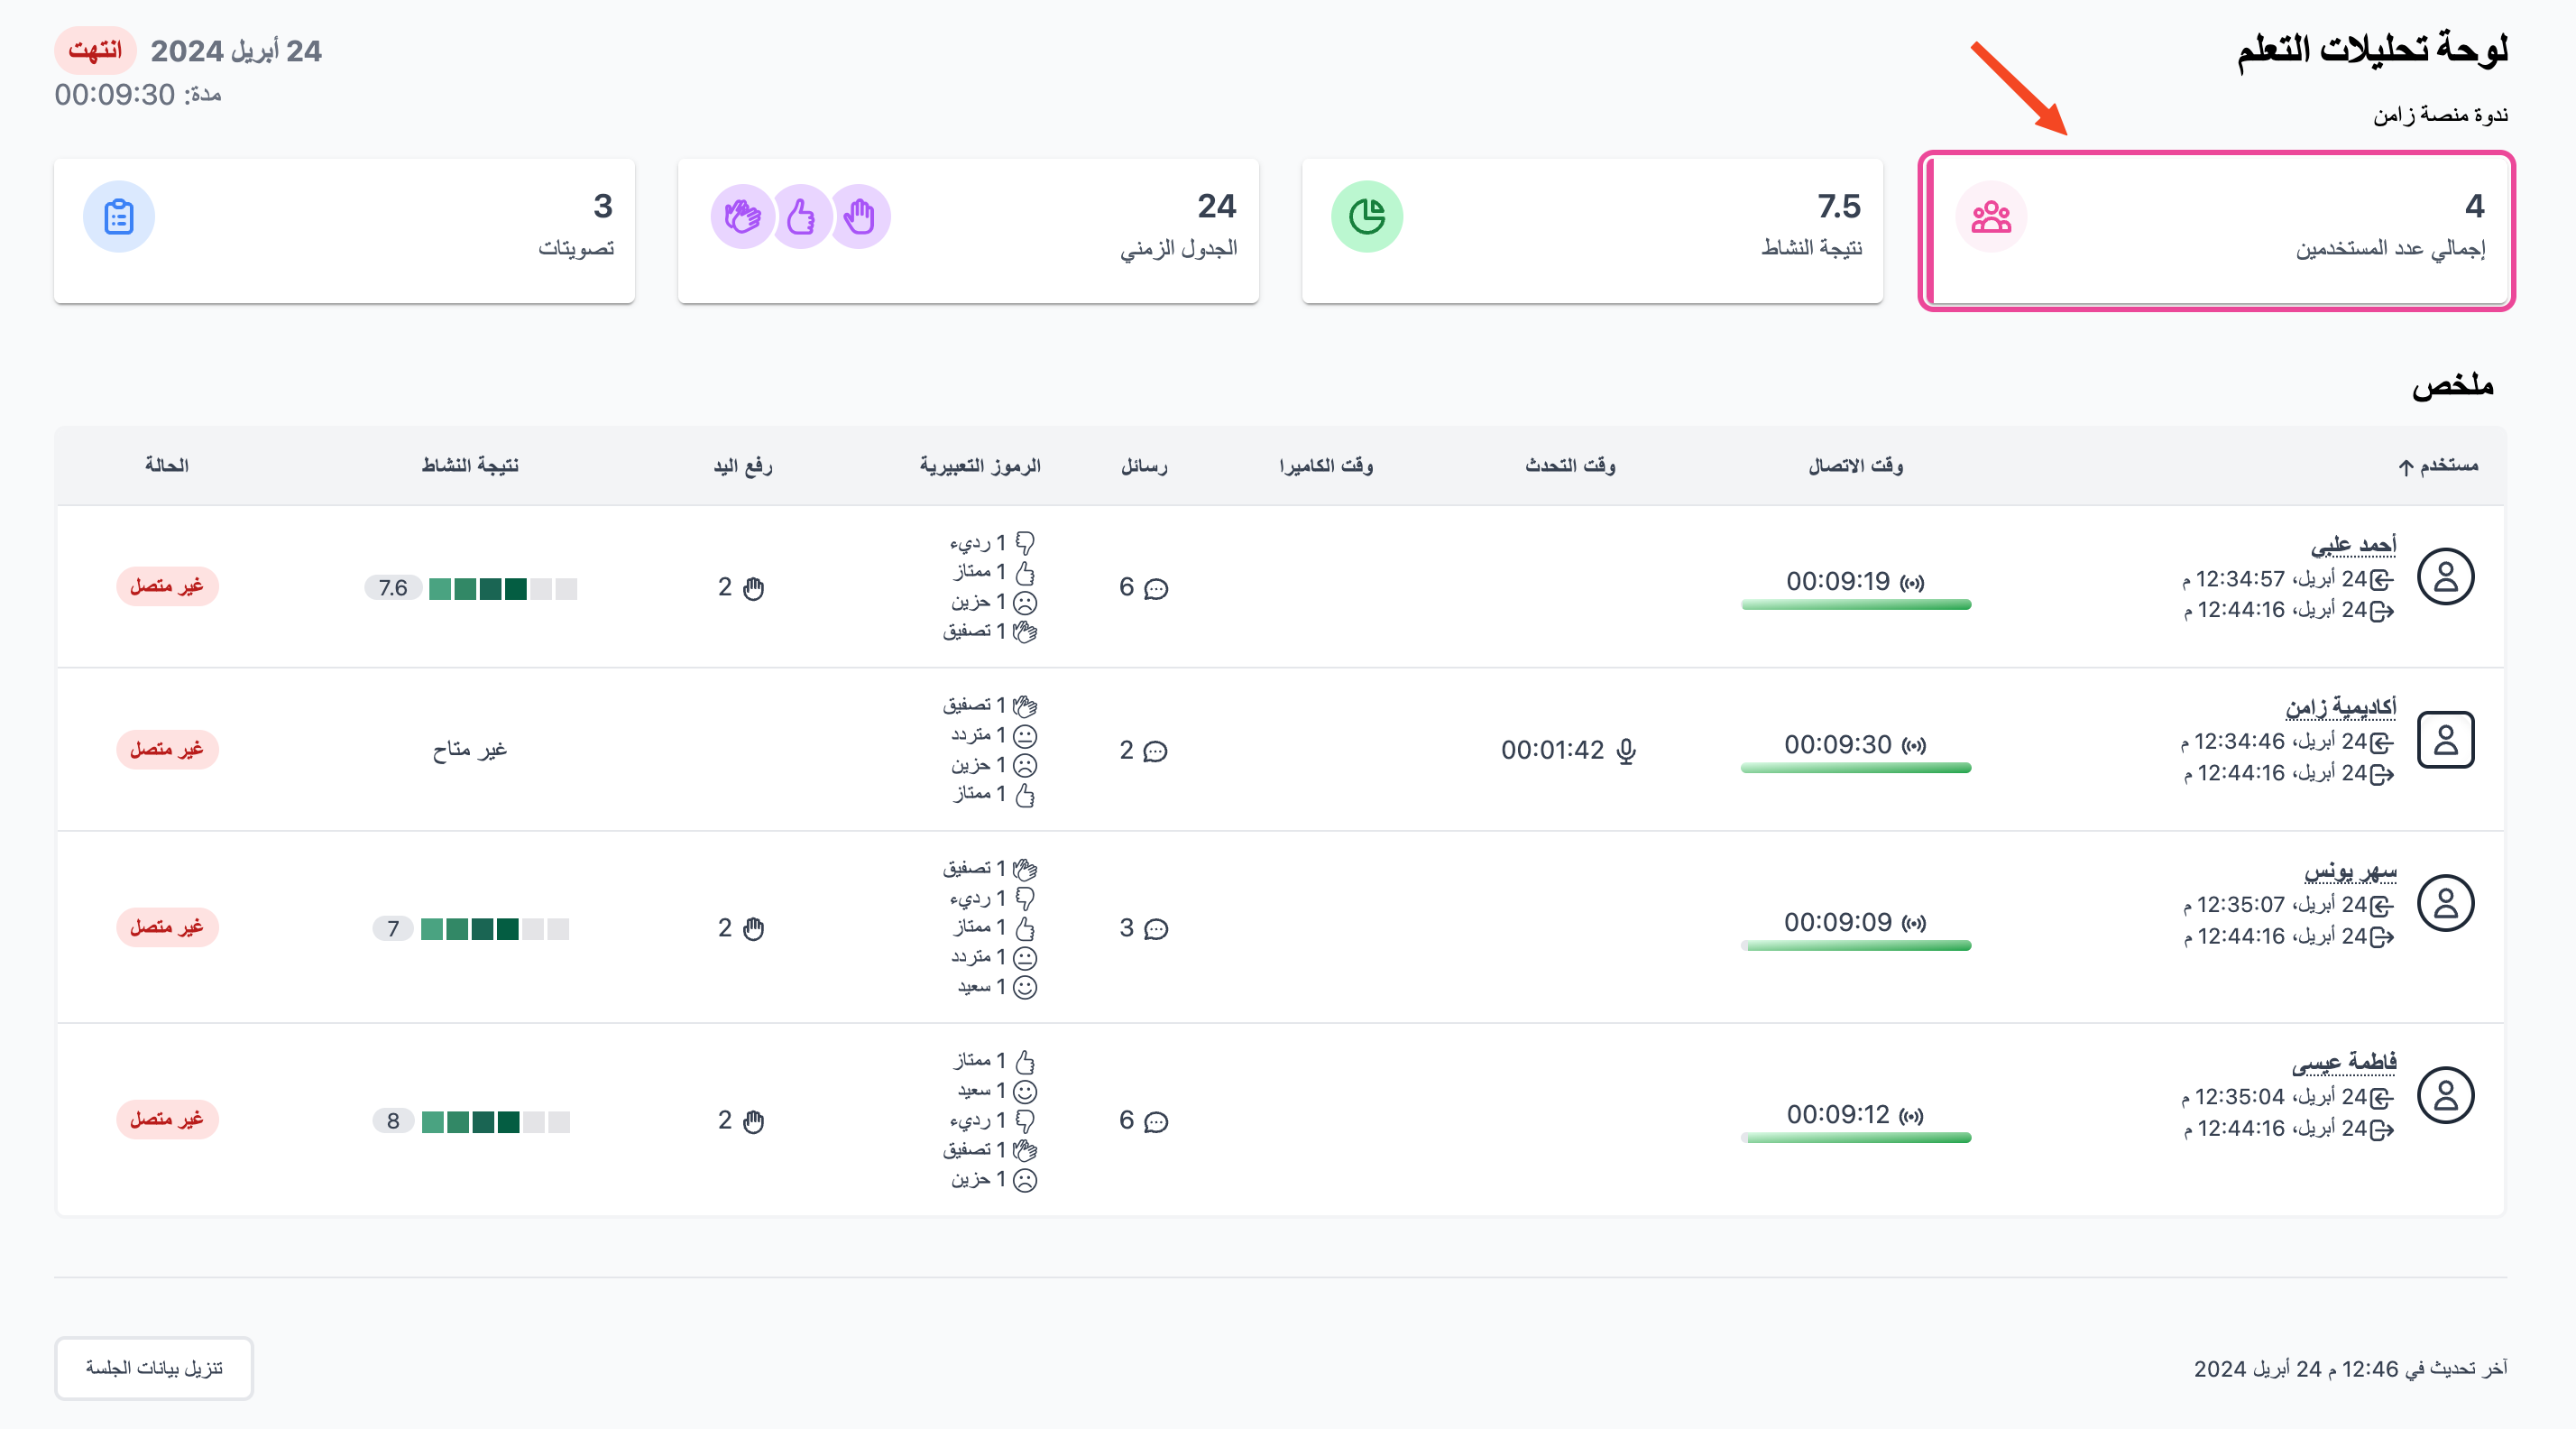
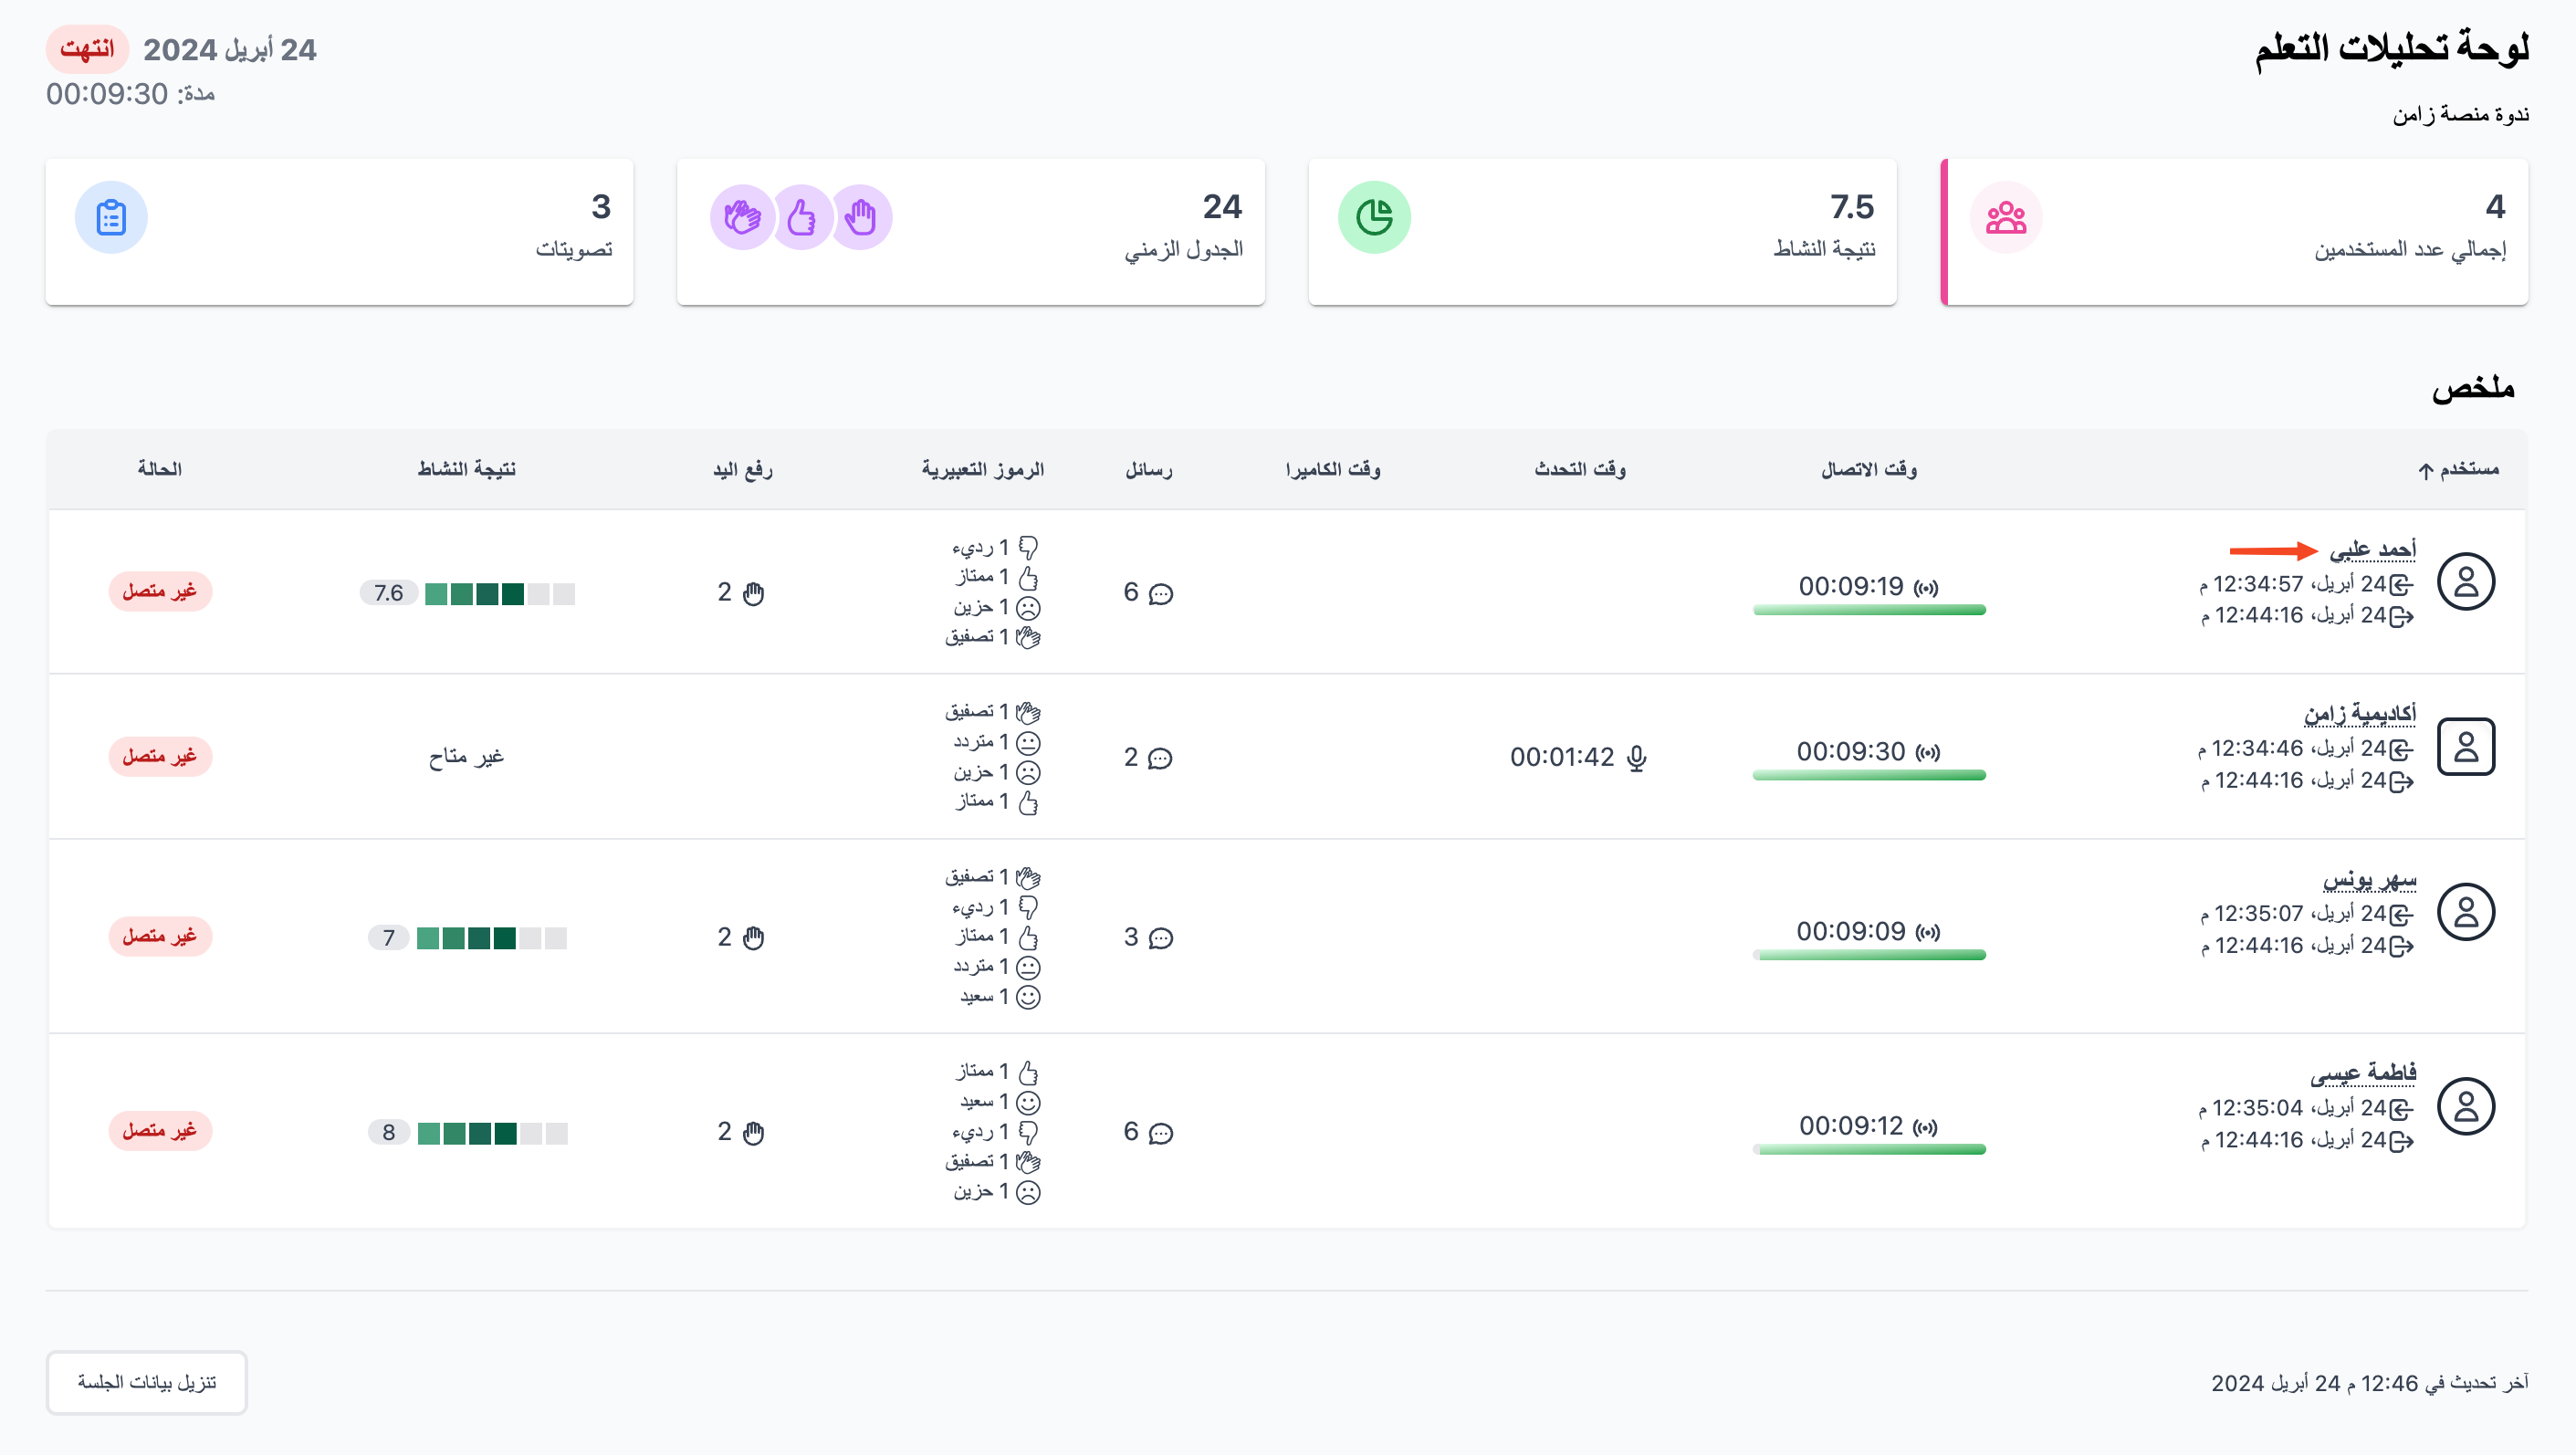
Click the Total Number Of Users card to see a summary of all users, including:
- Join time and leave time.
- Total online time.
- Talk time.
- Camera time.
- The number of messages sent in the chat.
- The emojis used.
- The number of raised hands.
- The average activity score.
- The status (it shows Offline if you open the dashboard after closing the room).
Activity score
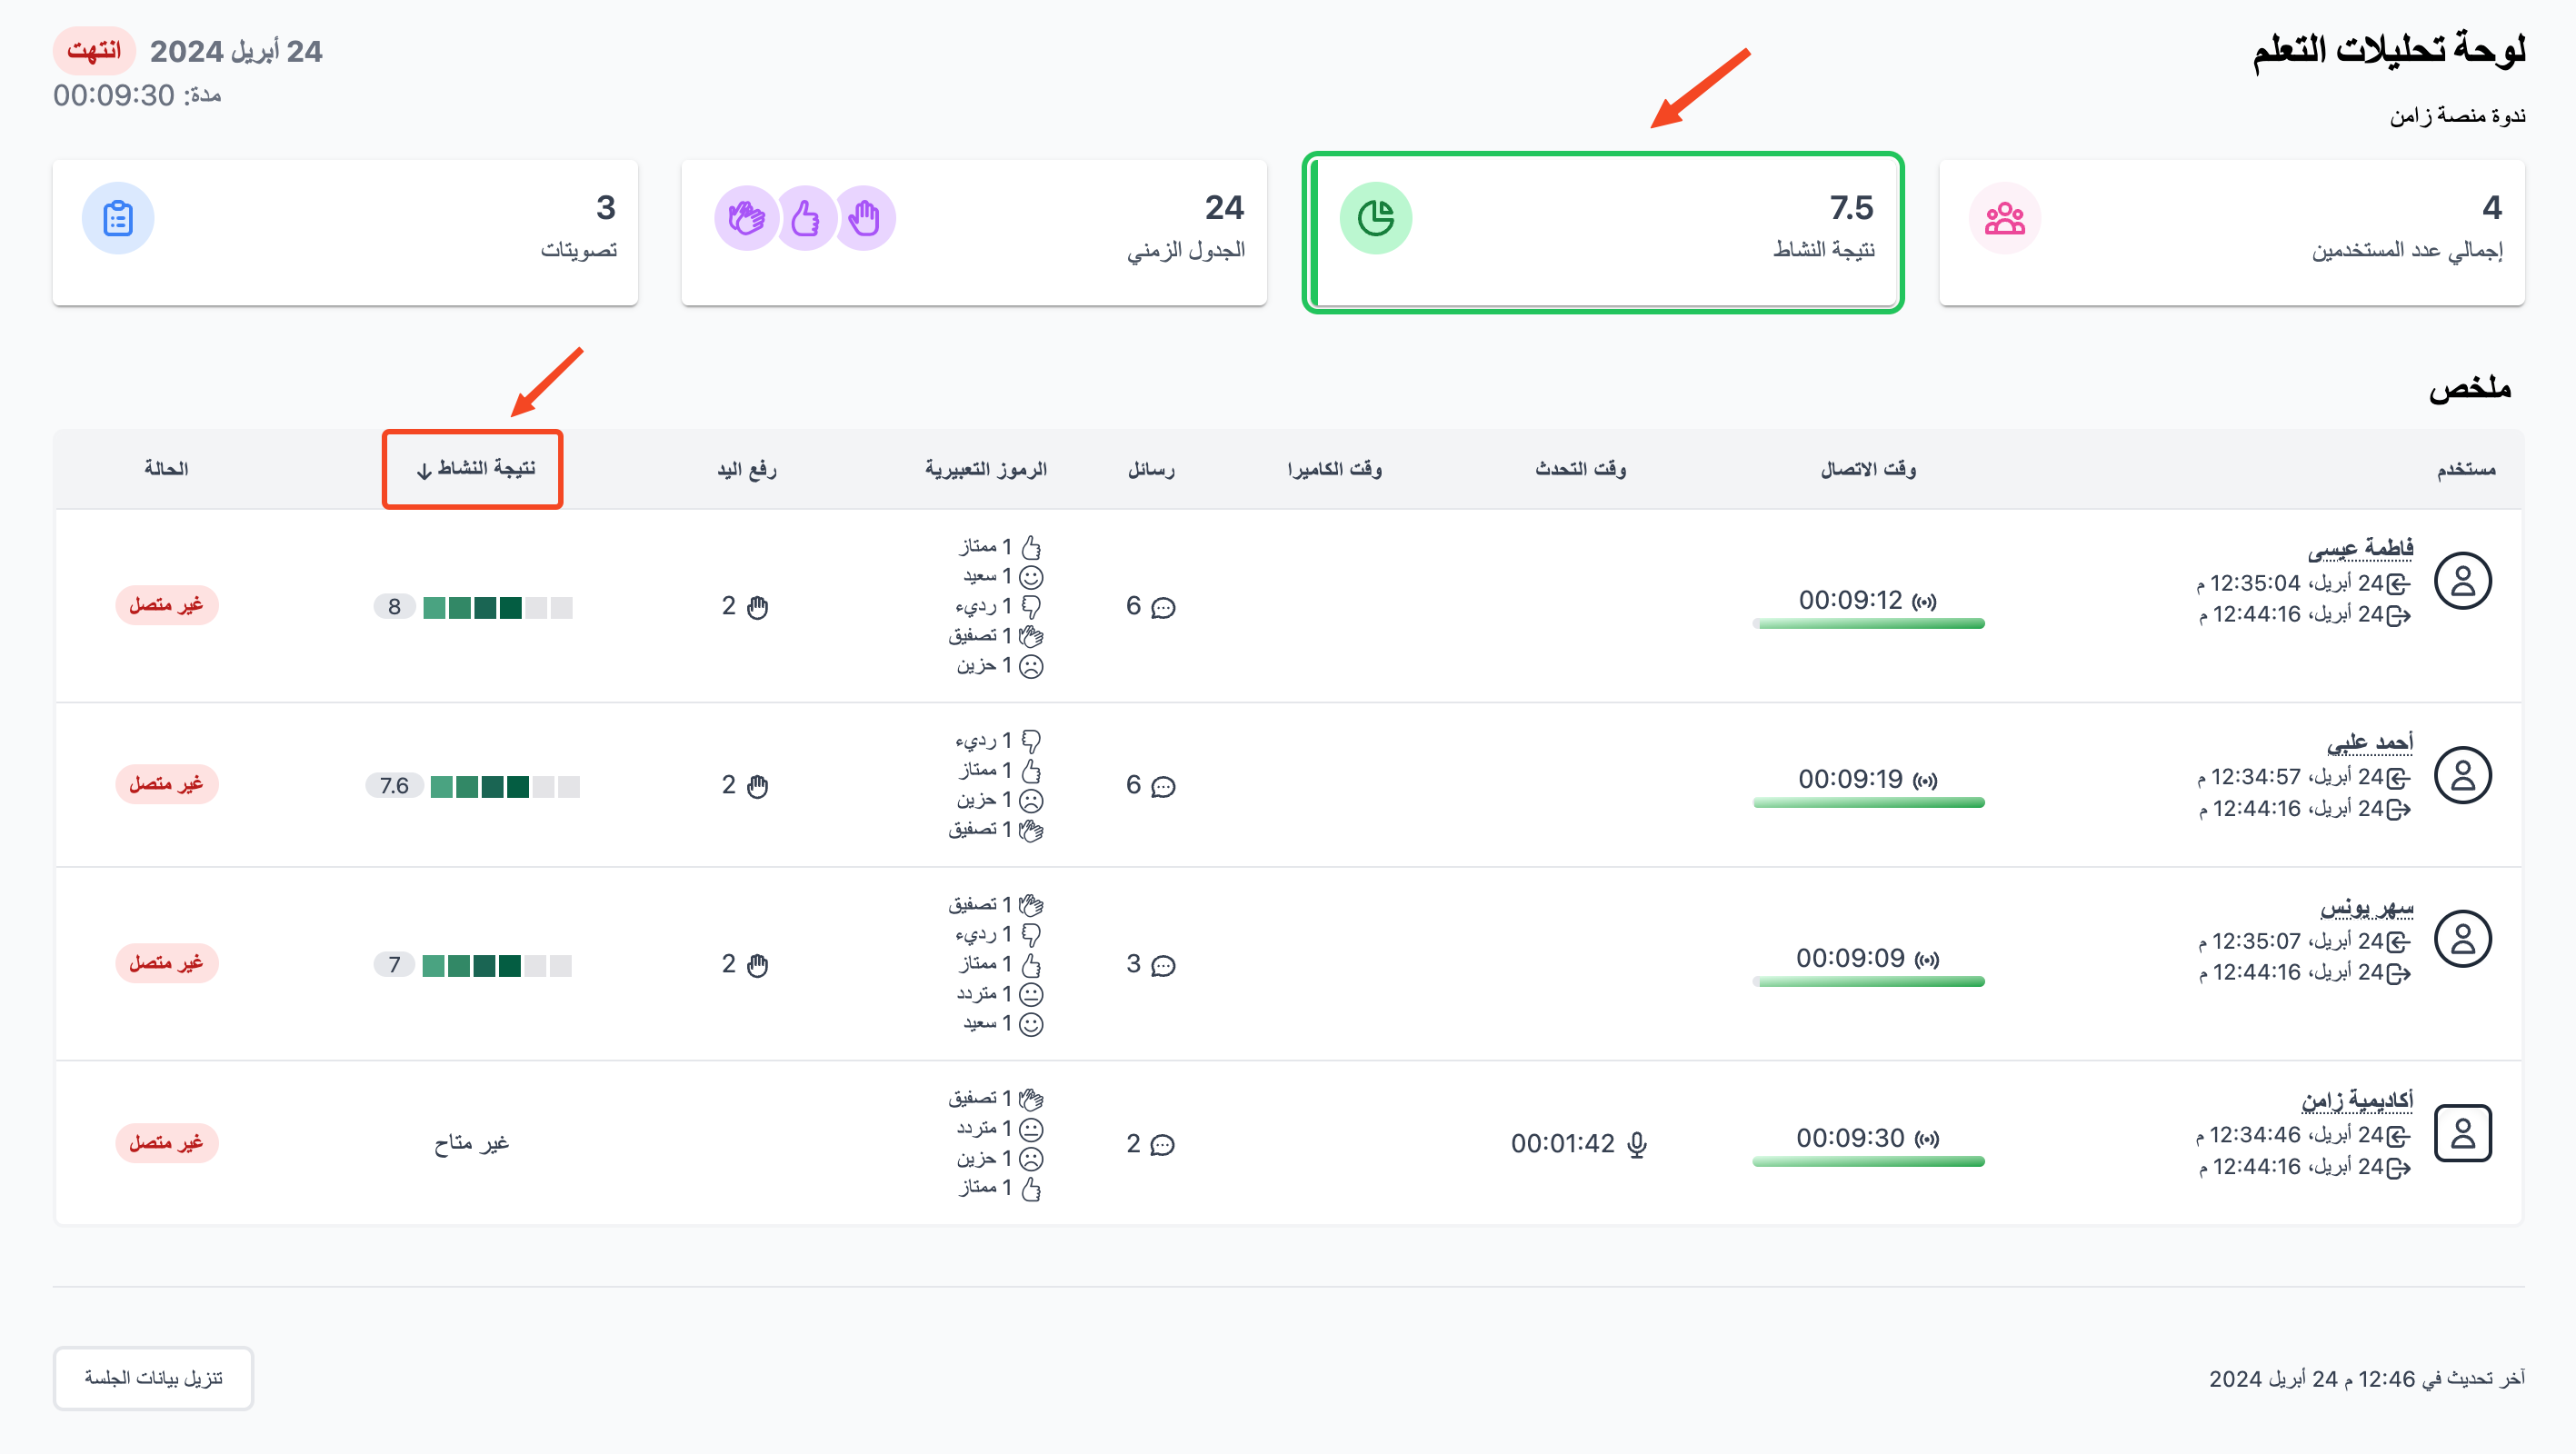
Click the Activity Score card, then click the Activity Score column title to sort users by their score from high to low or from low to high.
Timeline
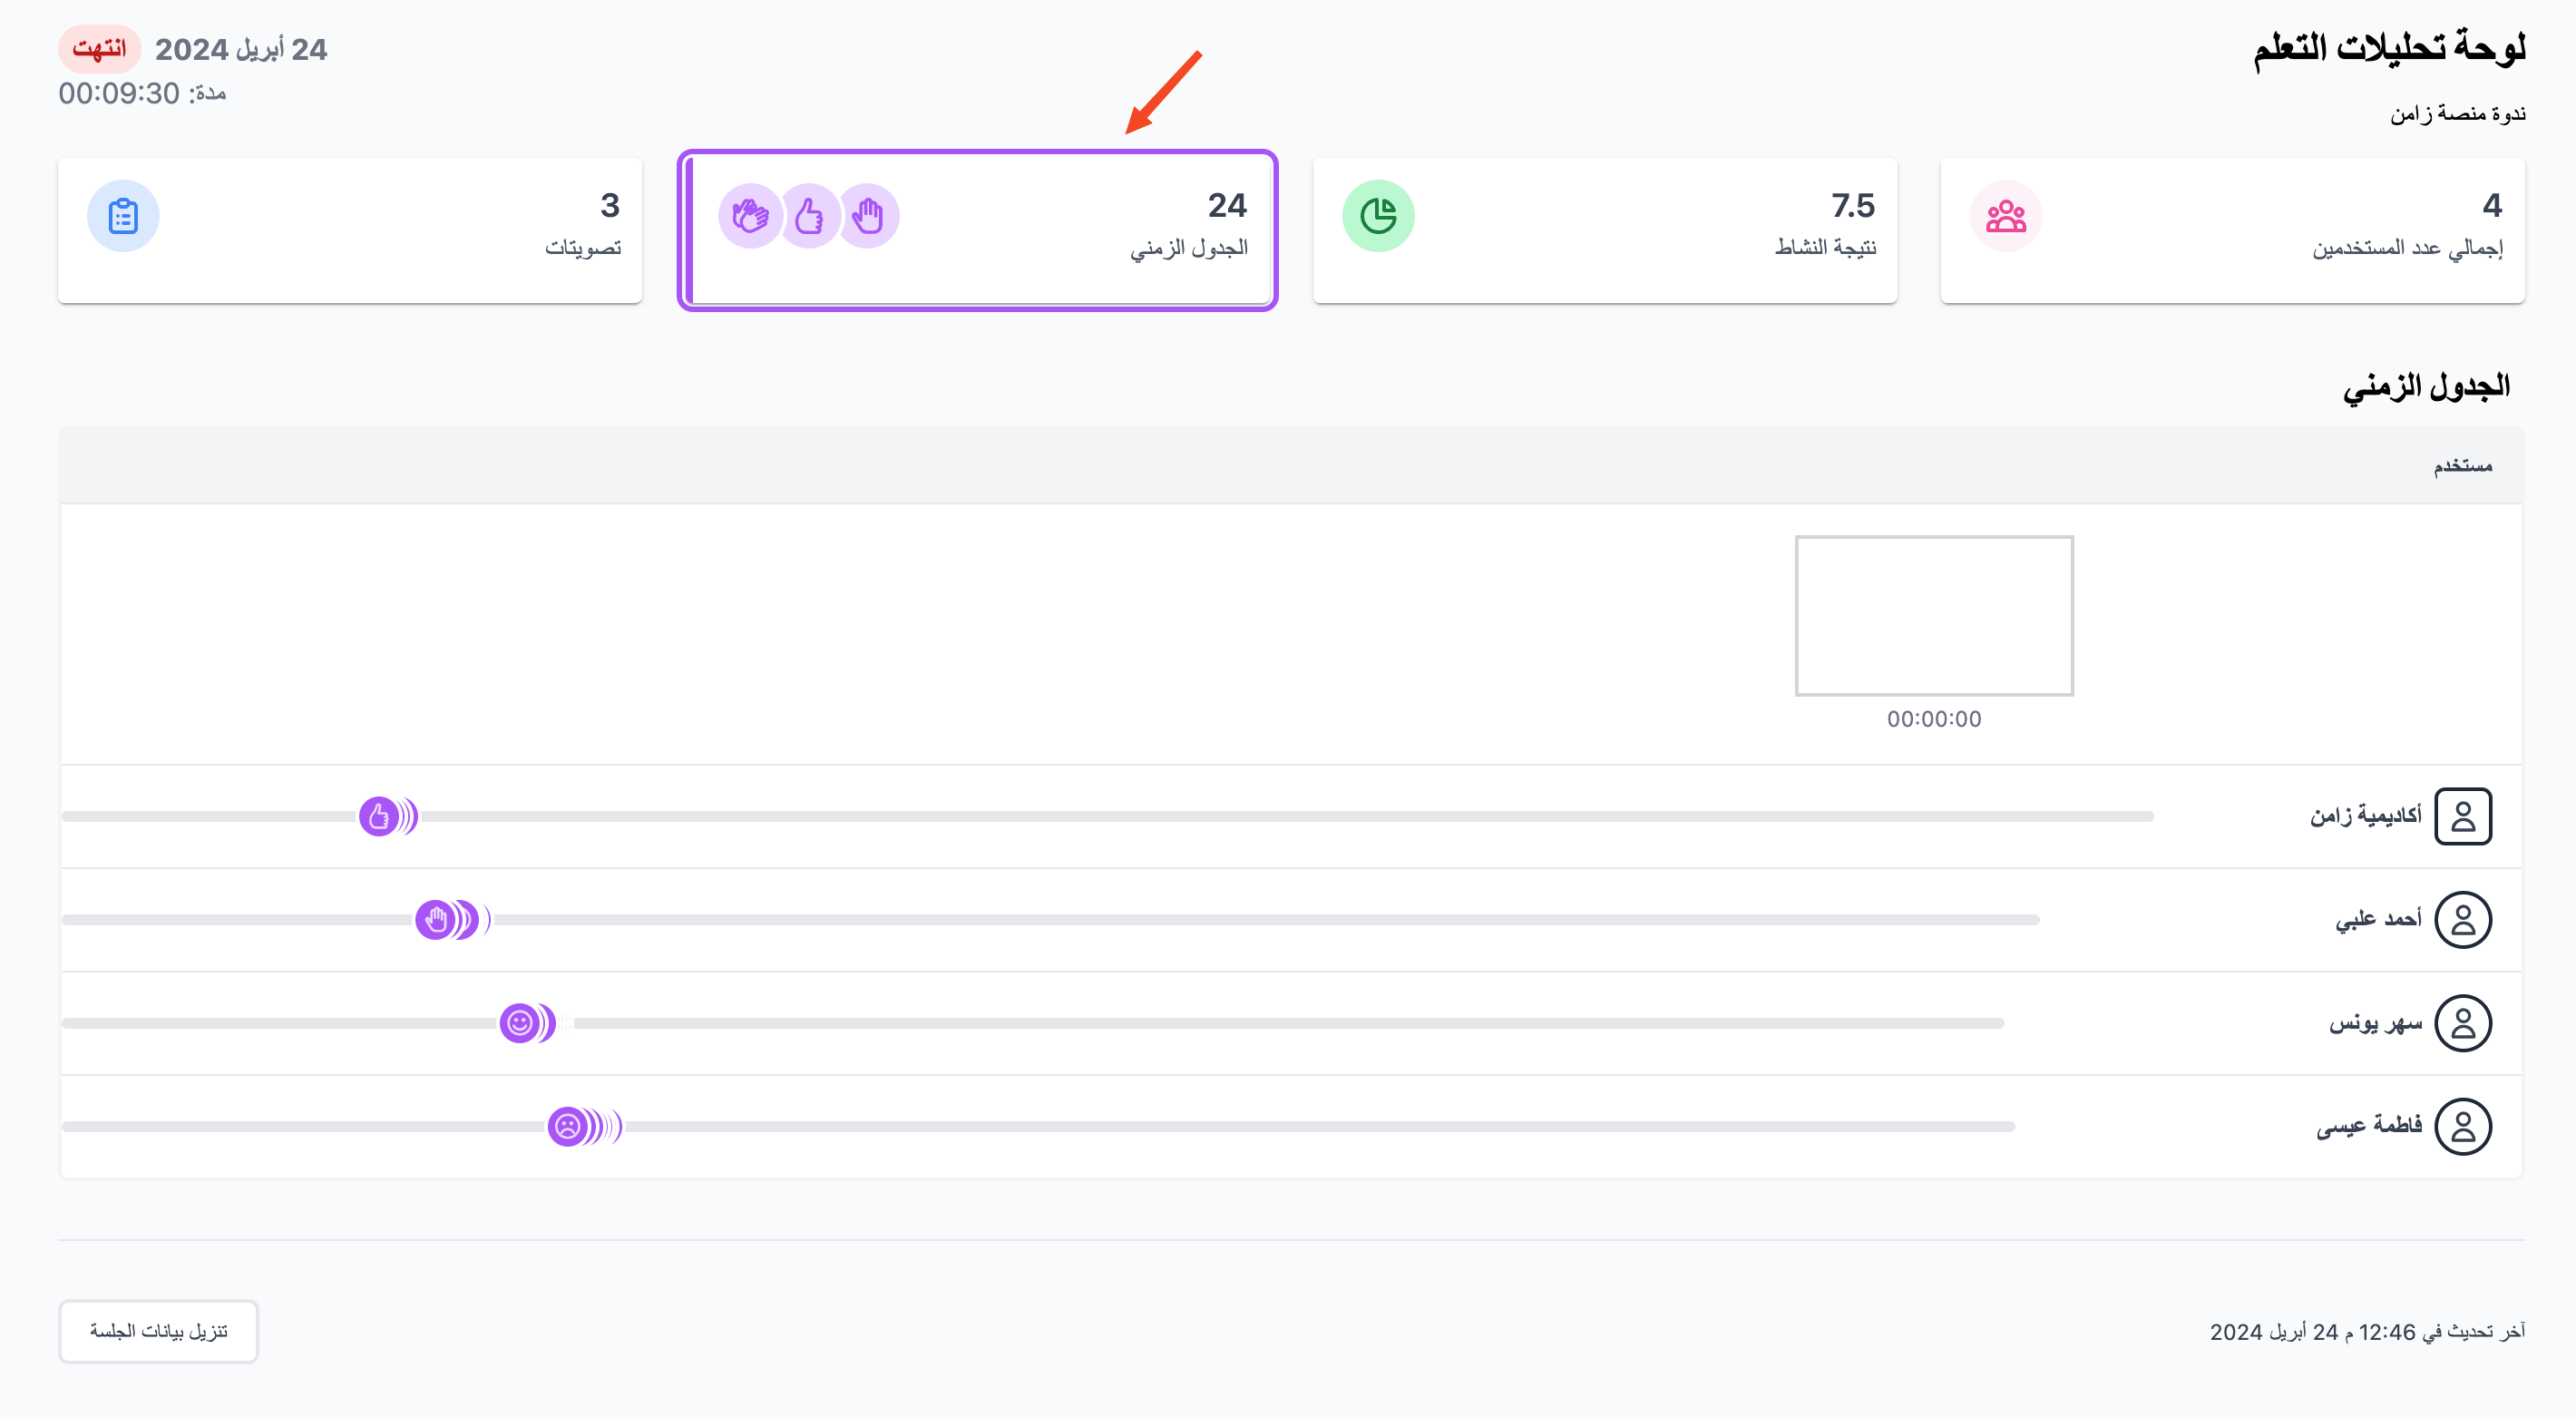
Click the Timeline card to see the attendees' interactions in detail on the session timeline.
Polls
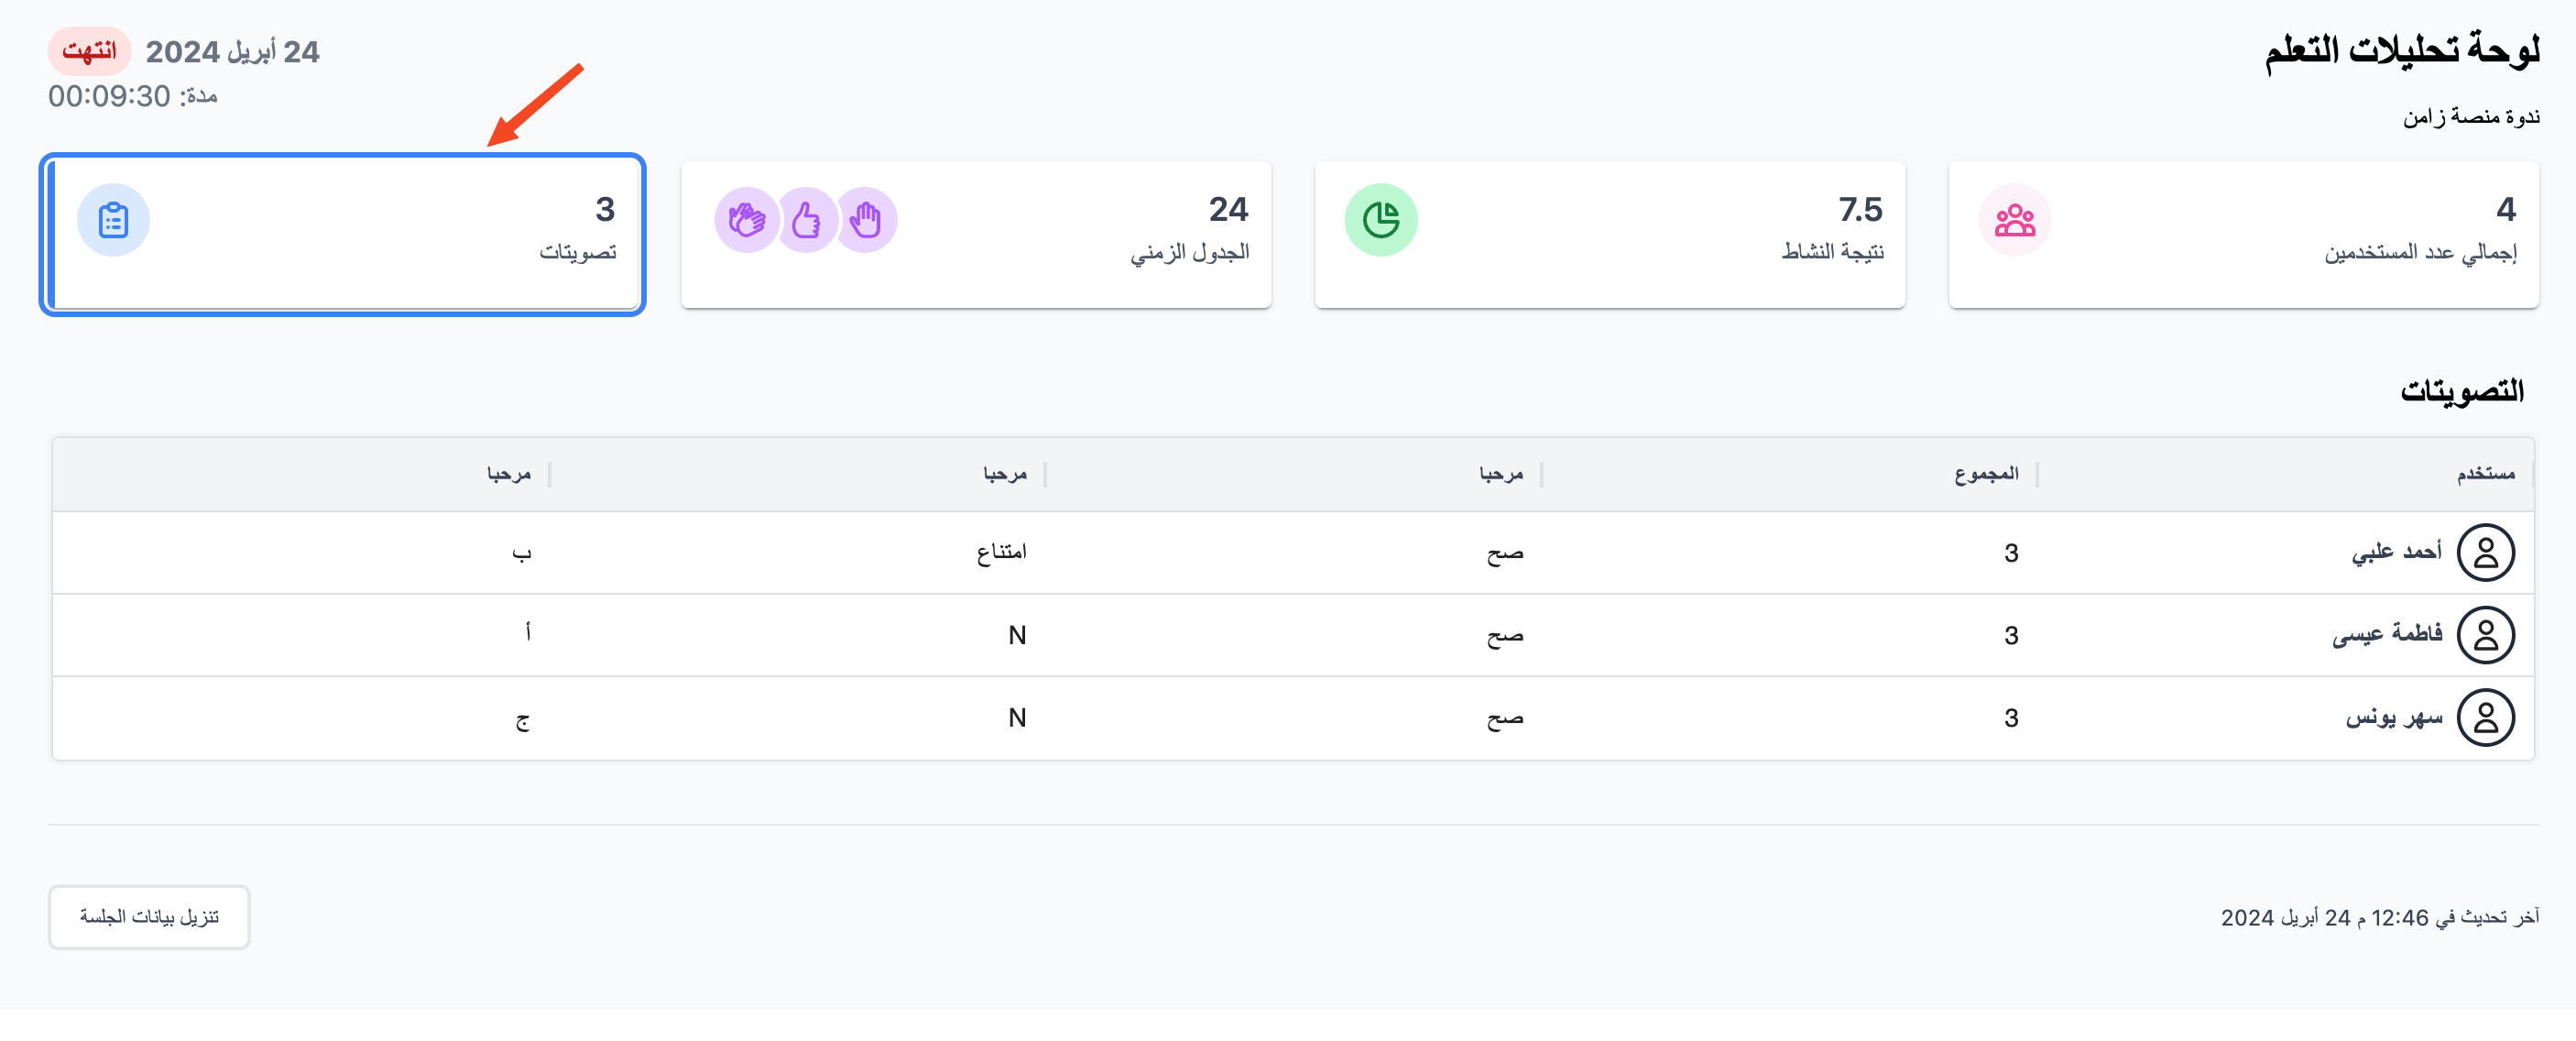
Click the Polls card to see all poll results.
User activity details
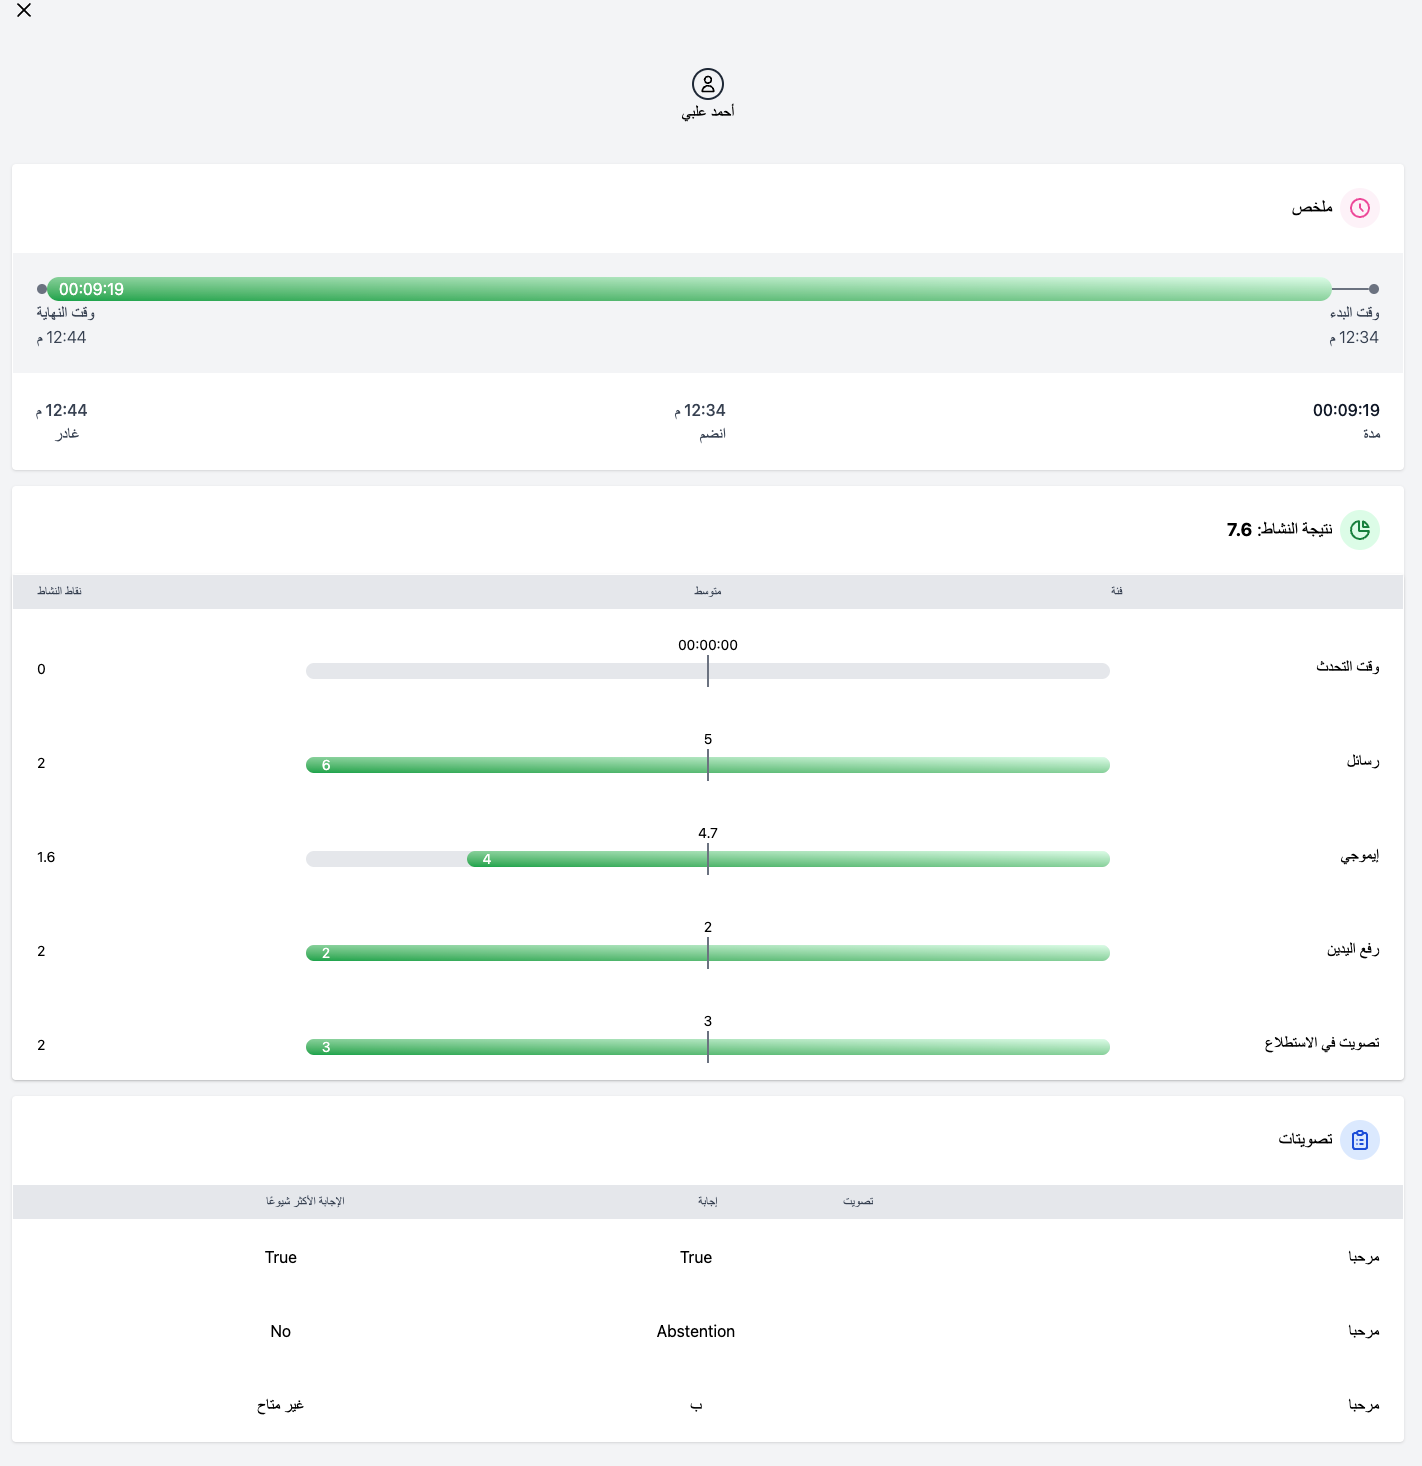
When you click a user's name, a page opens that shows all of that user's activity in the room in detail.
Download the session data
To download all session data, click Download Session Data at the bottom of the page.
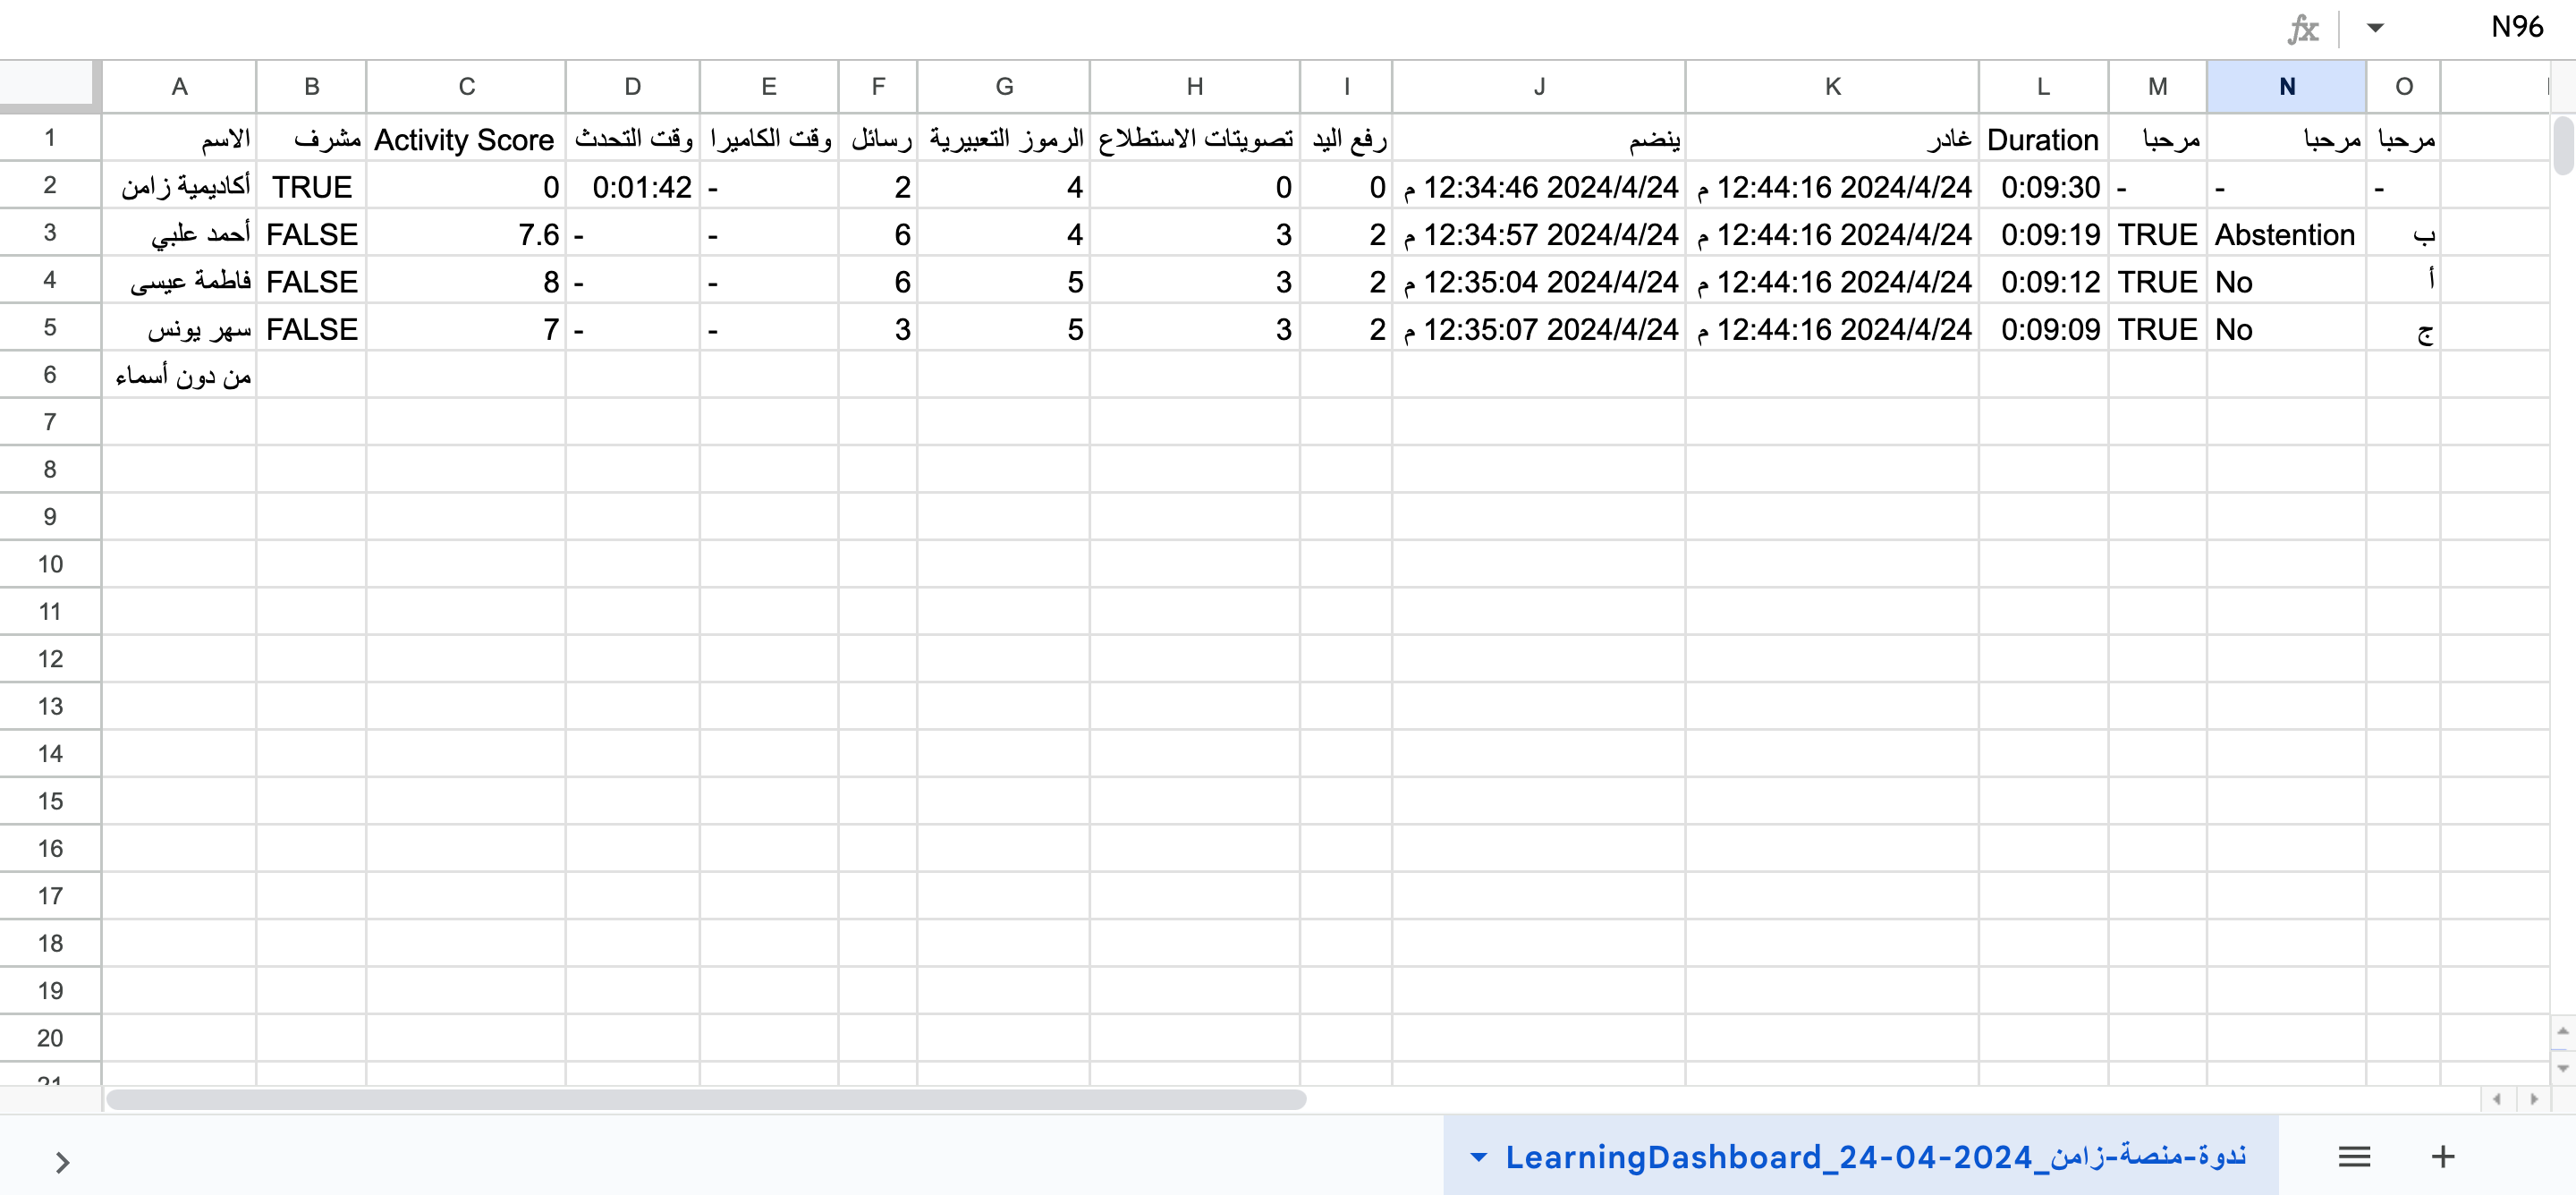
An example of the data after download: